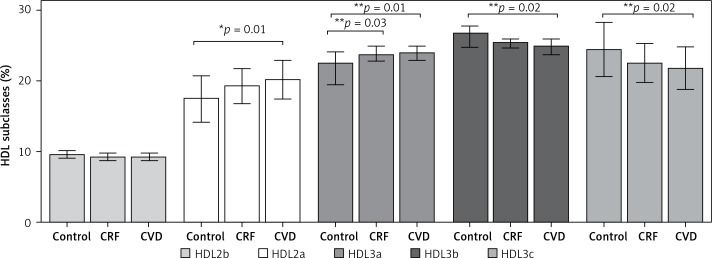
Figure 2.
HDL subclasses of the three groups studied. Results are expressed as the relative proportion (mean ± SD or median and interquartile range) of each HDL subclass calculated according to its migration distance in polyacrylamide gel and size intervals known for each HDL subclass. Comparisons between groups were made using *ANOVA, Bonferroni test, or **Kruskal-Wallis, Dunn test. Statistical significance level was accepted as p < 0.05

