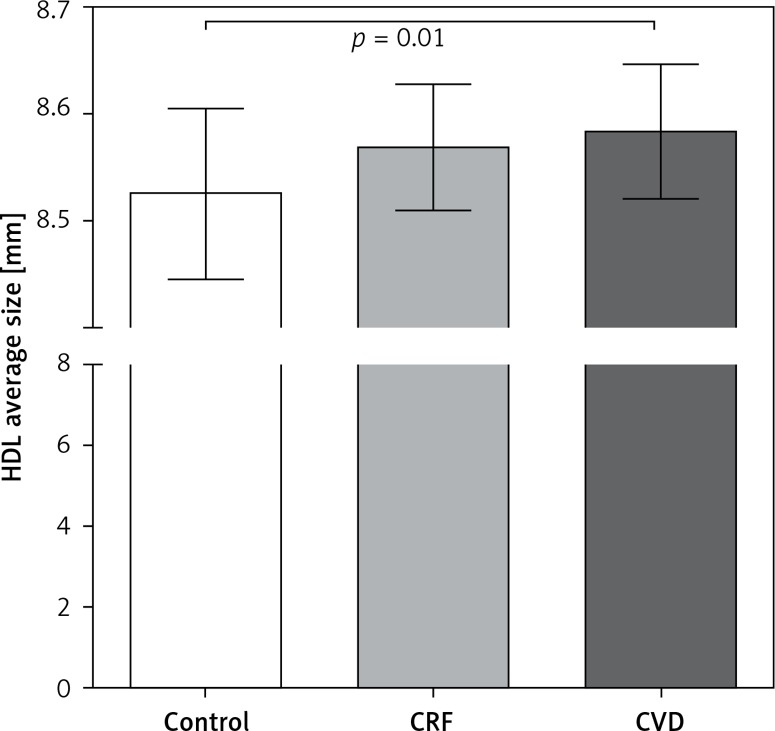
Figure 3.
HDL sizes among groups. The average HDL particle size represents the overall distribution of the HDL subclasses and was calculated as the average size of each HDL subclass interval in nm, multiplied by its relative area under the densitometric scan. Results are expressed as mean ± SD. Comparisons between groups were made using ANOVA and Bonferroni test. Statistical significance level was accepted as p < 0.05

