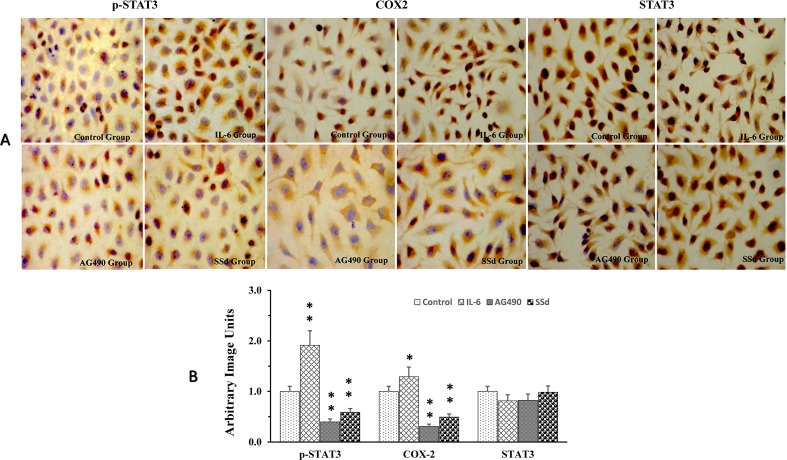
Figure 3.
Alteration of p-STAT3, COX-2, and STAT3 expression post-treatment with SSd. (A) Representative images of immunocytochemical staining of SMMC-7721 cells pre- and post-treatment with AG490, SSd, and IL-6. Control group: Cells treated with PBS; IL-6 group: Cells treated with IL-6 (25 ng/ml); AG90 group: Cells treated with IL-6 (25 ng/ml) + AG490 (25 µmol/L); and SSd group: Cells treated with IL-6 (25 ng/ml) + SSd (5 µg/ml). DAB used as chromogen; original magnification ×200: nuclear immunoreactivity. (B) Results from quantitative analysis of images using ImagePro Plus 7.1 software and data were expressed as arbitrary image units. **P < 0.01, *P < 0.05 compared to the control. Nucleus was stained using hematoxylin (blue), antibody staining (brown).

