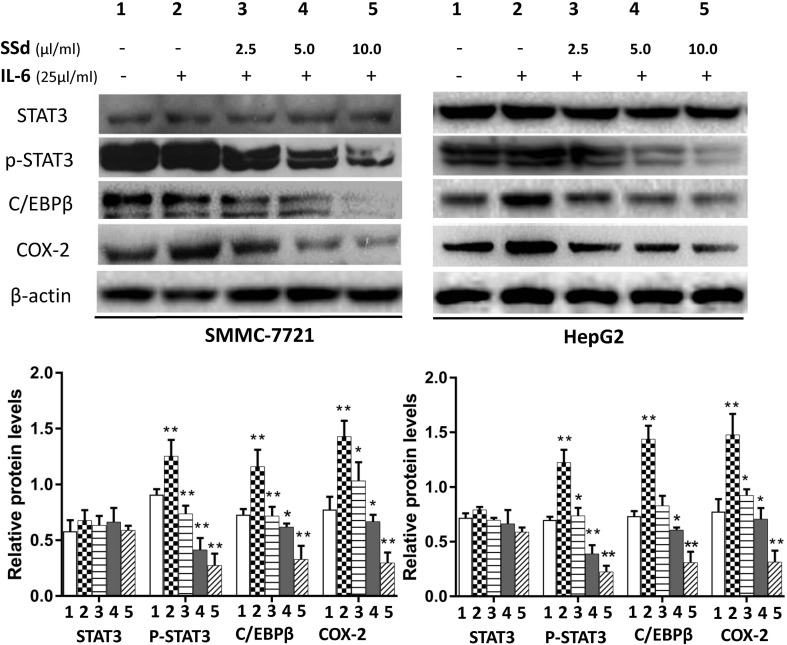
Figure 4.
Protein expression of total STAT3, p-STAT3, C/EBPβ, and COX-2 following treatment with SSd. SMMC-7721 and HepG2 cells were seeded into six-well plates (2.5 × 10⁵/well). After 24-h culture in RPMI-1640 medium, the cells were divided into five groups and treated with SSd in the following conditions: 1) Control group cells received no drug treatment; 2) cells treated with IL-6 (25 ng/ml) only; 3) cells treated with IL-6 (25 ng/ml) + SSd (2.5 µg/ml); 4) cells treated with IL-6 (25 ng/ml) + SSd (5.0 µg/ml); 5) cells treated with IL-6 (25 ng/ml) + SSd (10.0 µg/ml). Representative Western blot of results are shown in upper panels. For the quantitation of Western blots, protein expression was normalized to β-actin levels in each lane and expressed relative to levels in normal cells. The data are presented as the mean ± SD of three separate experiments. *P < 0.05 and **P < 0.01 when compared with group 2, where cells were treated with IL-6 only.

