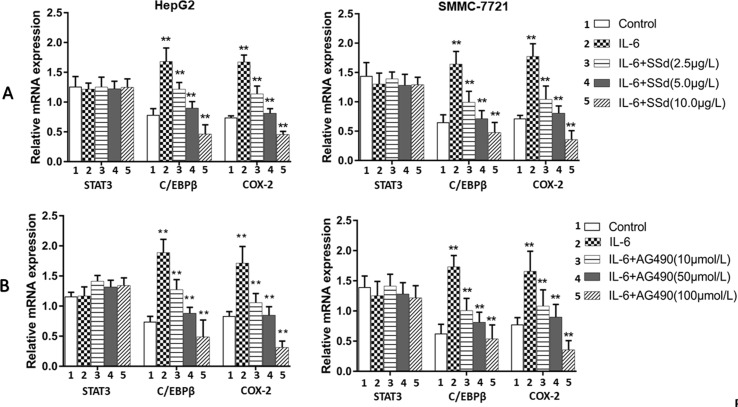
Figure 6.
Expression of mRNA for total STAT3, C/EBPβ, and COX-2 as determined by qRT-PCR. (A) SSd treated cells. Upper panel: Tumor cells (HepG2 and SMMC-7721) were divided into five groups and treated with different concentrations of SSd as follows: 1) control group: cells received no drug treatment; 2) cells treated with IL-6 (25 ng/ml) only; 3) cells treated with IL-6 (25 ng/ml) + SSd (2.5 µg/ml); 4) cells treated with IL-6 (25 ng/ml) + SSd (5.0 µg/ml); 5) cells treated with IL-6 (25 ng/ml) + SSd (10.0 µg/ml). (B) AG490 treated cells. Lower panel: Both HepG2 and SMMC-7721 cells were divided into identical five groups and treated AG490 as various concentrations as follows: 1) control group: cells received no drug treatment; 2) cells treated with IL-6 (25 ng/ml) only; 3) cells treated with IL-6 (25 ng/ml) + AG490 (10 µmol/L); 4) cells treated with IL-6 (25 ng/ml) + AG490 (50 µmol/L); 5) cells treated with IL-6 (25 ng/ml) + AG490 (100 µmol/L). Data are expressed as relative expression using the ΔΔCq method. **P < 0.01 and *P < 0.05 compared with group 2 (cells treated with 25 ng/ml IL-6).

