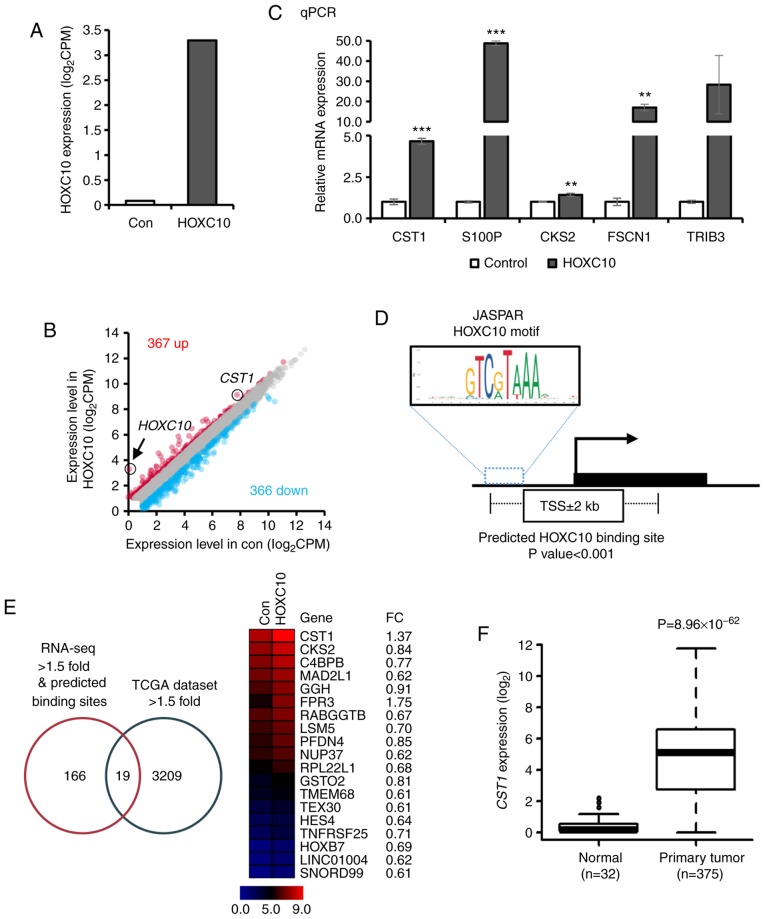
Figure 4.
Selection of a direct target of HOXC10 by RNA-sequencing data analysis. (A) HOXC10 expression levels from RNA-sequencing in response to ectopic HOXC10 overexpression in AGS cells. (B) Scatter plot of expression level of 733 genes (|log2 FC| >1.5) from RNA-seq. (C) Validation of upregulated genes in RNA-sequencing results by RT-qPCR (**P<0.01, ***P<0.001; Student's t-test. The error bars represent the mean ± SD). (D) Predicted HOXC10 binding motif site sequence from the database JASPAR. (E) Predicted target genes via RNA-sequencing, predicted binding sites and TCGA expression dataset. (F) Comparison of CST1 expression in normal and tumor gastric tissues (TCGA datasets). HOXC10, homeodomain-containing gene 10.

