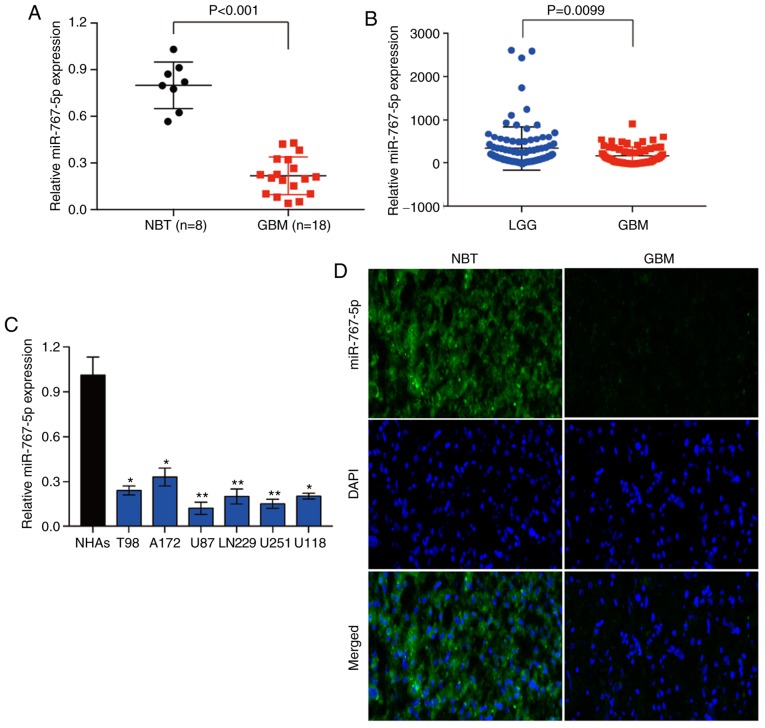
Figure 1.
miR-767-5p is downregulated in GBM specimens and cell lines compared with normal brain tissues and NHAs. (A) RT-qPCR analysis of miR-767-5p expression in 8 normal brain specimens and 18 GBM tissue specimens. (B) miR-767-5p expression in GBM tissues (n=94) and (LGG n=64) based on data from the CGGA database. (C) RT-qPCR analysis of miR-767-5p levels in NHAs and 6 glioma cell lines. (D) Representative images revealing FISH analysis of miR-767-5p expression in GBM and NBT. Nuclei were stained with DAPI. Data are presented as the means ± SD. *P<0.05, **P<0.01 compared to NHAs. GBM, glioblastoma multiforme; NHAs, normal human astrocytes; LGG, low-grade glioma; CGGA, Chinese Glioma Genome Atlas; FISH, fluorescence in situ hybridization; NBT, normal brain tissue; SD, standard deviation.

