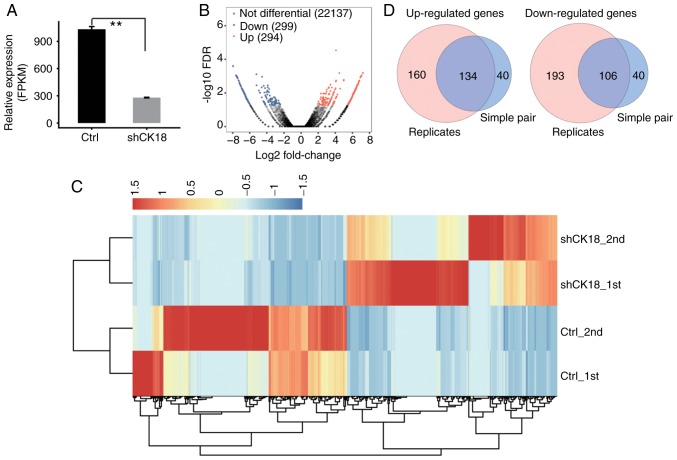
Figure 2.
Differential gene expression in response to CK18 KD. (A) Quantification of CK18 expression using RNA-seq data, FPKM values were calculated as explained in Materials and methods. (B) Volcano plot of the CK18-regulated genes using edgeR software (filtering criteria, FC ≥2 and FDR<0.05) treating RNA-seq data from two samples in each group as experimental replicates. Red indicates upregulated genes and blue indicates downregulated genes. (C) Heat map of all the 593 differentially expressed genes in the control and CK18 shRNA-treated samples. (D) Overlap of two sets of DEGs. One set was identified as described in B. The other set was identified by treating one CK18 shRNA-treated and one control RNA-seq data as a simple pair using edgeR software; the resulting two pairs of DEGs were then overlapped to obtain the common simple-pair DEGs. CK18, cytokeratin 18; FPKM, fragments per kilobase of transcript per million fragments mapped; DEGs, differentially expressed genes.

