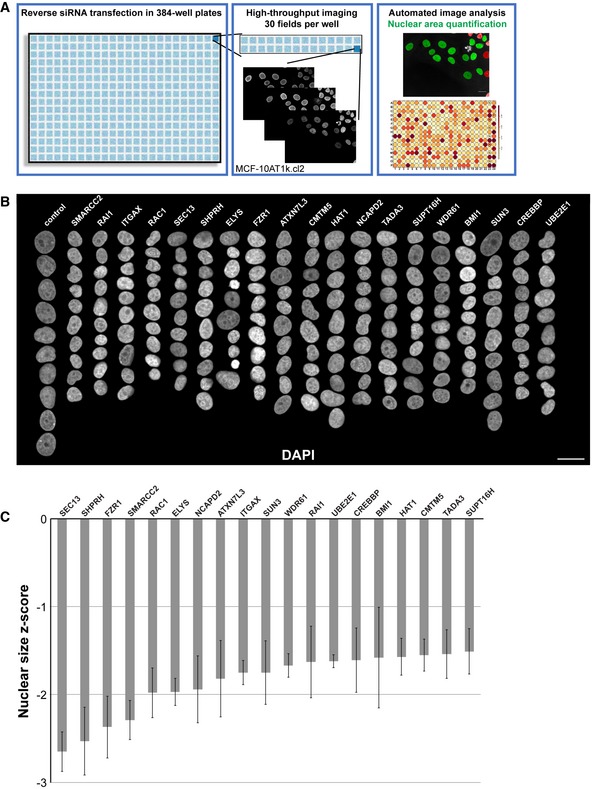
Figure 1. An imaging‐based siRNA screen for gene knockdowns that reduce nuclear size.

- The screening approach is depicted, and details are available in the Materials and Methods. Throughout the study, a premalignant breast cancer cell line was used (MCF‐10AT1k.cl2), unless otherwise indicated. Images and data shown in this figure were obtained directly from the screen. Scale bar, 20 μm.
- Montages of representative DAPI‐stained nuclei are shown for gene knockdowns that led to reduced nuclear size. Ten nuclei per column, organized by maximum nuclear size z‐score. Scale bar, 25 μm.
- Median nuclear size z‐scores are plotted for gene knockdowns that led to reduced nuclear size. Data are based on three different siRNA oligo sequences for each gene and two biological replicates. Error bars represent the SEM for biological replicates.
