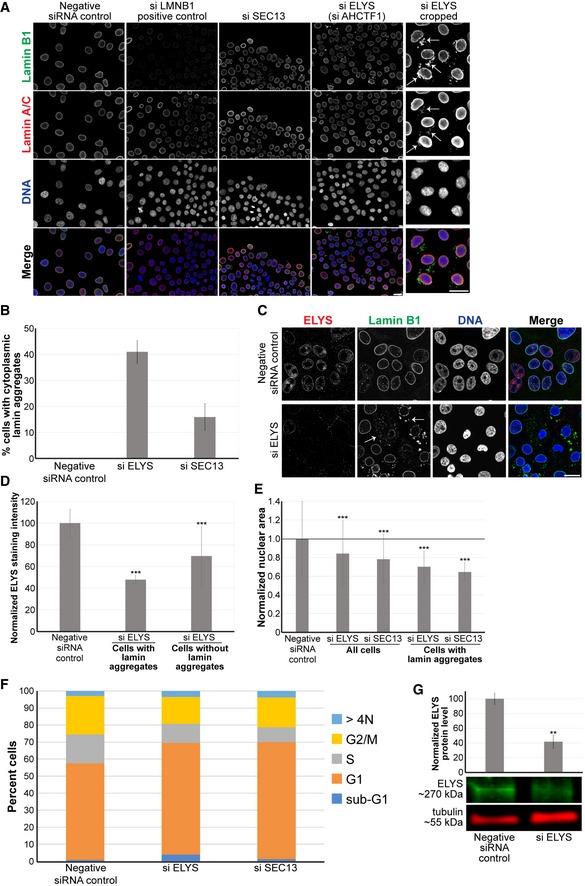
Figure EV1. ELYS and SEC13 knockdown lead to smaller nuclei and the formation of cytoplasmic lamin aggregates.

-
ARepresentative images from the screen are shown. To the far right, ELYS knockdown nuclei were cropped to highlight cytoplasmic lamin aggregates indicated with arrows.
-
BCells with and without cytoplasmic lamin B1 aggregates were counted, and the percentage of cells with aggregates was calculated. For each experiment, 698–1,213 cells were examined per condition. Data are shown for two siRNA sequences for each gene and two biological replicates.
-
C, DCells were transfected with control or ELYS siRNA and stained with ELYS and lamin B1 antibodies as indicated. Representative images are shown. Some examples of cytoplasmic lamin aggregates are indicated with arrows. For each experiment, nuclear ELYS staining intensity was quantified for 90–143 nuclei per condition and normalized to the negative control. Data from two biological replicates are shown. ELYS knockdown was greater in cells with lamin aggregates.
-
ENuclear cross‐sectional areas were quantified for 70–762 nuclei per condition, averaged, and normalized to the negative control. Six biological replicates, data from one representative experiment shown. While not all ELYS and SEC13 knockdown cells exhibited cytoplasmic lamins, those that did had smaller nuclei compared to knockdown cells without cytoplasmic lamin accumulations. This suggests that accumulation of lamins in the cytoplasm is associated with smaller nuclei.
-
FMCF‐10AT1k.cl2 cells were transfected with control siRNA or with siRNA against the indicated genes. Cells were stained with DAPI, and quantification of DNA staining intensity was used to estimate the fraction of cells in various stages of the cell cycle by high‐throughput imaging as previously described 123 (see Materials and Methods). The stacked bars represent the means of the fractions for each cell cycle phase calculated over 3 biological replicates. The control data are the same shown in Fig. 6D. Median cell number z‐scores were 0.35 (P‐value 0.62) and 0.41 (P‐value 0.34) for ELYS and SEC13 knockdown, respectively, indicating no significant effect on cell numbers.
-
GCell lysates from control and ELYS siRNA‐transfected cells were analyzed by Western blot and probed for ELYS and tubulin. One representative Western blot is shown. ELYS band intensity was normalized to tubulin. Quantification from two biological replicates is shown.
