-
A
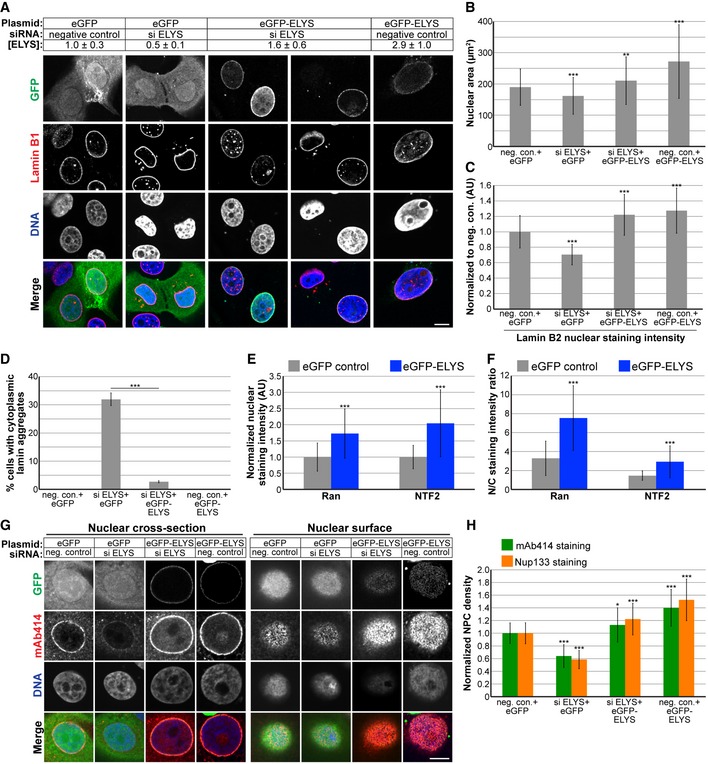
MCF‐10AT1k.cl2 cells were co‐transfected with control or ELYS siRNA and plasmids expressing eGFP alone or siRNA‐resistant eGFP‐ELYS. Cell lysates were analyzed by Western blot and probed for ELYS and tubulin. ELYS band intensity was normalized to tubulin and then normalized to the eGFP/negative siRNA control. ELYS concentrations are indicated in the row labeled [ELYS] (average ± SD). Quantification was performed on two biological replicates. Cells were stained with an antibody against lamin B1. Representative images are shown.
-
B
For each experiment, nuclear cross‐sectional areas were quantified for 68–298 nuclei per condition (162 nuclei on average) and averaged. Three biological replicates, data from one representative experiment shown.
-
C
For each experiment, nuclear lamin B2 staining intensities were quantified for 29–81 nuclei per condition (60 nuclei on average) and normalized to the eGFP/negative siRNA control. Two biological replicates, data from one representative experiment shown.
-
D
Cells with and without cytoplasmic lamin B2 aggregates were counted, and the percentage of cells with aggregates was calculated. For each experiment, 58–299 cells were examined per condition. Three biological replicates, data from one representative experiment shown.
-
E, F
Cells were stained with antibodies against Ran and NTF2. For each experiment, 62–130 nuclei were quantified per condition (92 nuclei on average). Two biological replicates, data from one representative experiment shown. (E) Nuclear Ran and NTF2 staining intensities were quantified and normalized to the eGFP control. (F) To measure the N/C staining intensity ratio of a given cell, the average fluorescence intensity of a nuclear region was divided by the average fluorescence intensity of a cytoplasmic region.
-
G
Transfections were performed as in (A) and cells were stained with an antibody against FG‐Nups (mAb414) and Nup133. Representative images for mAb414 staining are shown. Confocal imaging was performed through nuclear cross‐sections as well as on the surface of nuclei.
-
H
To measure NPC densities, confocal NE surface images were acquired for mAb414‐ and Nup133‐stained nuclei. NPC numbers were counted per unit area for 25–116 nuclei per condition (53 nuclei on average) and normalized to the negative control. Two biological replicates, data from one representative experiment shown.
< 0.05. Scale bars are 10 μm. Error bars represent SD.

