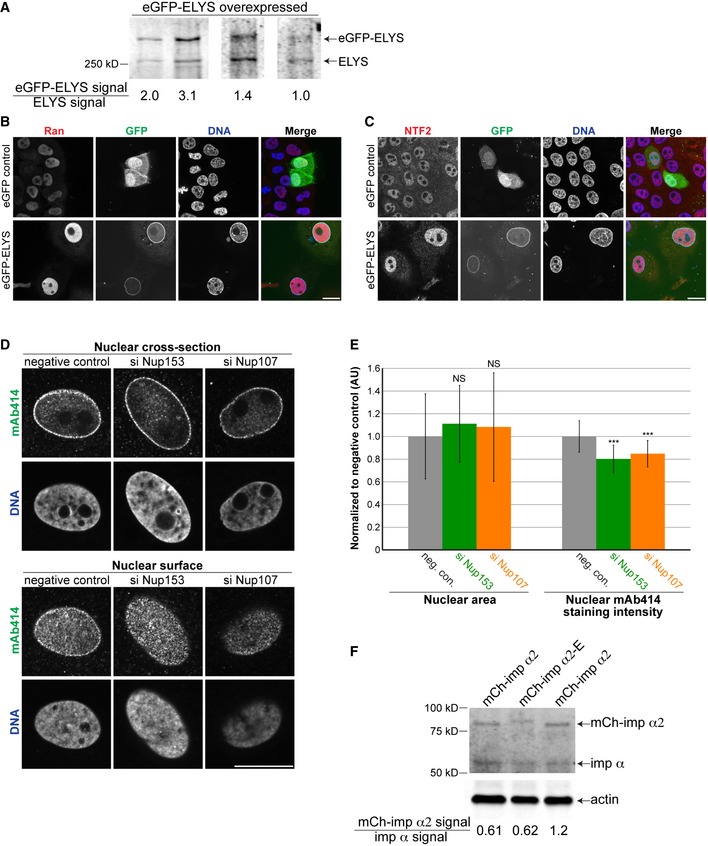
Figure EV3. ELYS overexpression, Nup153 and Nup107 knockdowns, and importin α overexpression.

- MCF‐10AT1k.cl2 cells were transfected with a plasmid expressing eGFP‐ELYS. Cell lysates were analyzed by Western blot and probed for ELYS. The signal from the ectopically expressed eGFP‐ELYS band was divided by the signal from the endogenous ELYS band, indicated below the blots. Ectopically expressed eGFP‐ELYS was expressed 1.9 ± 0.9‐fold (average ± SD) above endogenous ELYS levels, based on four biological replicates.
- MCF‐10AT1k.cl2 cells were transfected with plasmids expressing eGFP alone or eGFP‐ELYS. Cells were stained with a Ran antibody. Representative images are shown.
- MCF‐10AT1k.cl2 cells were transfected with plasmids expressing eGFP alone or eGFP‐ELYS. Cells were stained with an NTF2 antibody. Representative images are shown.
- MCF‐10AT1k.cl2 cells were transfected with control, Nup153, or Nup107 siRNA and stained with an antibody against FG‐Nups (mAb414). Cells were co‐transfected with BLOCK‐iT Alexa Fluor red fluorescent control to identify transfected cells. Representative images are shown. Confocal imaging was performed through nuclear cross‐sections as well as on the surface of nuclei. Cytoplasmic staining for FG‐Nups apparent in ELYS knockdown cells (Fig 2D) was not evident upon knockdown of Nup153 or Nup107.
- Nuclear cross‐sectional areas were quantified for 36–49 nuclei per condition (41 nuclei on average), averaged, and normalized to the siRNA negative control. Nuclear mAb414 staining intensity was quantified for 36–49 nuclei per condition (41 nuclei on average), averaged, and normalized to the siRNA negative control. Data from three biological replicates are shown.
- MCF‐10AT1k.cl2 cells were transfected with plasmids expressing mCherry‐importin α2 or mCherry‐importin α2‐E 30. Cell lysates were analyzed by Western blot and probed for importin α and β‐actin. The signal from the ectopically expressed mCherry‐importin α2 band was divided by the signal from the endogenous importin α band, indicated below the blots. Ectopically expressed mCherry‐importin α2 was expressed at 81% ± 35% (average ± SD) of endogenous importin α levels, based on three biological replicates.
