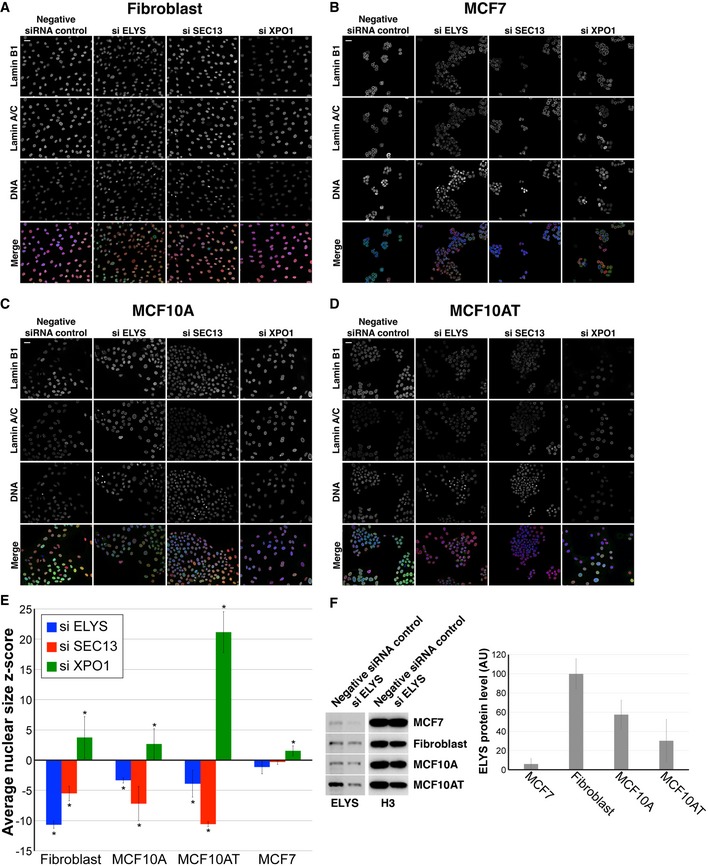
The indicated cell lines were transfected with a negative siRNA control or siRNA against ELYS, SEC13, or XPO1. Cells were stained with DAPI and with antibodies against lamin B1 and lamin A/C.
Representative images for hTERT immortalized CRL‐1474 cells, roughly normal human skin fibroblasts.
Representative images for MCF7 cells, breast adenocarcinoma cells.
Representative images for MCF‐10A cells, roughly normal breast epithelial cells.
Representative images for MCF‐10AT1k.cl2 cells, breast epithelial cells with atypical hyperplasia.
Nuclear cross‐sectional areas were quantified, and z‐scores were calculated as described in
Materials and Methods. For each cell line and condition, > 500 cells were quantified and the average
z‐score and SD from three biological replicates are plotted.
Cell lysates were analyzed by Western blot and probed for ELYS and histone H3. Band intensities were quantified, and ELYS signal was normalized to the histone H3 signal to obtain the relative ELYS protein levels in each cell line. Average data from three biological replicates are plotted. Notably, ELYS levels are lowest in MCF7 cells and ELYS was efficiently knocked down by siRNA treatment, eliminating high ELYS expression or poor ELYS knockdown as reasons for why ELYS knockdown minimally affected nuclear size in MCF7 cells.
Data information: *absolute value of the
z‐score is greater than 1.5. Scale bars are 25 μm. Error bars represent SD.

