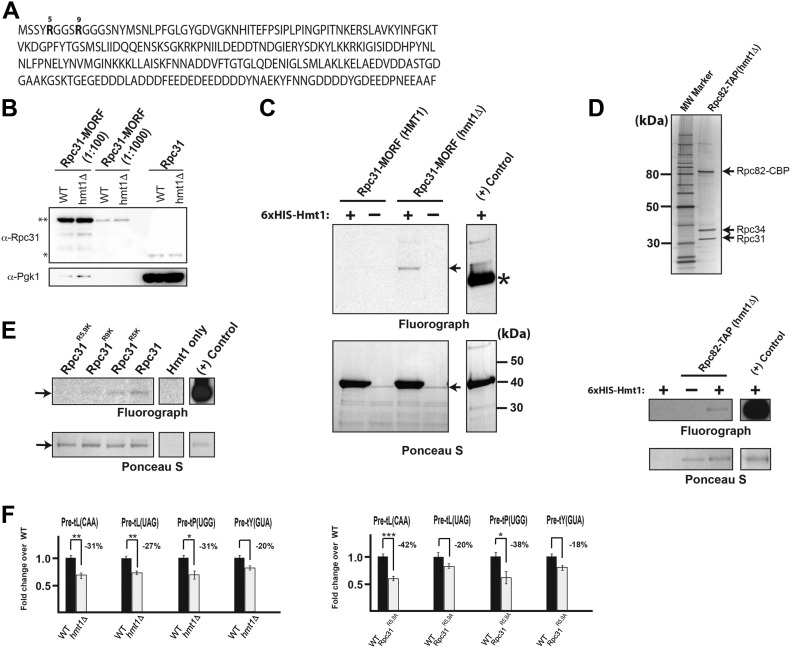
Figure 2. Under optimal growth conditions, Hmt1 methylates Rpc31 and loss of this modification adversely affects biogenesis of pre-tRNAs.
(A) The amino acid sequence of yeast Rpc31 with methylated arginines at positions 5 and 9 denoted in bold lettering. (B) Immunoblotting showing the relative levels of Rpc31-MORF to endogenous Rpc31 was analyzed using lysates made from WT and hmt1Δ cells. Double asterisks denote MORF-tagged Rpc31 and a single asterisk denotes endogenous Rpc31. The level of Pgk1 is used as a loading control for the relative total protein levels loaded. (C) In vitro methylation of Rpc31 from the yeast MORF collection, after purification from WT and hmt1Δ cells, using recombinant Hmt1 and [methyl-3H]-SAM. The full protein complement in each reaction was resolved on a 4–12% SDS–PAGE; methylation was visualized by fluorography (arrow) and protein levels by Ponceau S staining. Recombinant GST-tagged Rps2 served as a positive control (highlighted by asterisk). (D) Biochemical purification of TAP-tagged Rpc82 from hmt1Δ cells. TAP was performed from hmt1Δ cells expressing TAP-tagged Rpc82 (top panel). The purified proteins were resolved on a 4–12% SDS–PAGE and the gel was silver stained to determine the protein composition (bottom panel). The TAP-purified Rpc82 and associated proteins were subjected to an in vitro methylation assay using recombinant Hmt1 and [methyl-3H]-SAM. The full protein complement in each reaction was resolved on a 4–12% gel by SDS–PAGE. Methylation of Rpc31 was visualized by fluorography and protein levels by Ponceau S staining. Recombinant GST-tagged Rps2 served as a control. (E) In vitro methylation of GST-tagged WT Rpc31, Rpc31R5K, Rpc31R9K, and Rpc31R5,9K, after purification from Escherichia coli, using recombinant Hmt1 and [methyl-3H]-SAM. Visualization of methylation and protein as in Part (B). Recombinant GST-tagged Rps2 served as a positive control. (F) Fold change in levels of pre-tRNAs in hmt1Δ or Rpc31R5,9A versus WT cells under optimal growth condition in either SC + glucose (for WT versus hmt1Δ cells) or YPD (for WT versus Rpc31R5,9A cells), as assessed by hybridization of probes to intronic regions. Bars show abundance of pre-tRNAs tL(CAA), tL(UAG), tP(UGG), and tY(GUA) in hmt1Δ (left panel) or Rpc31R5,9A (right panel) relative to those in WT cells. In each case, the signal was normalized based on the levels of U4 snRNA. Error bars represent the SEM of three biological replicates (n = 3). P-value as calculated by t test: *<0.05 and **<0.01.

