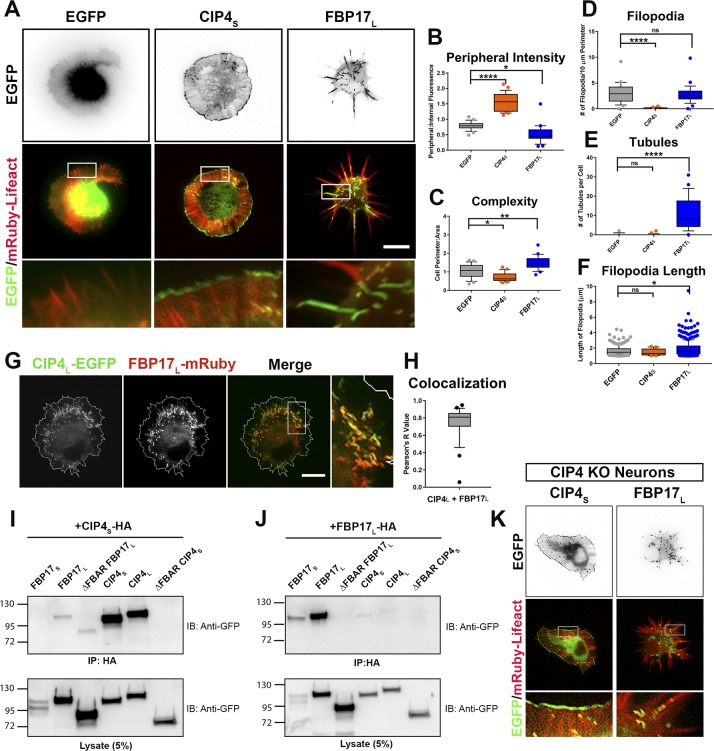
Figure S1. CIP4 and FBP17 expression results in opposing phenotypes and do not associate with one another.
(A) Images of living cortical neurons cotransfected with mRuby-Lifeact (red) and either EGFP, CIP4S-EGFP, or FBP17L-EGFP (green). (B–F) Box-and-whisker plots showing quantification of stage 1 neurons comparing the effects of transfection of EGFP, CIP4S-EGFP, or FBP17L-EGFP on peripheral intensity (B), cell complexity (C), filopodia number (D), tubule number (E), and filopodial length (F) 12 h postplating. EGFP (n = 26 cells), CIP4S-EGFP (n = 24 cells), and FBP17L-EGFP (n = 24 cells). (G) Images of a cortical neuron cotransfected with CIP4L-EGFP and FBP17L-mRuby. (H) Box-and-whisker plot showing average colocalization (Pearson’s correlation coefficient) of CIP4L with FBP17L in cortical neurons (n = 28 cells). (I, J) Co-IPs from HEK-293 cells expressing either CIP4S-HA or FBP17L-HA and EGFP-labeled FBP17 and CIP4 constructs. (K) Images of CIP4 KO cortical neurons cotransfected with mRuby-Lifeact and either CIP4S-EGFP and FBP17L-EGFP. Data for all graphs are shown as box-and-whisker plots with data points showing data that falls outside of the 10–90 percentile. *P < 0.05, **P < 0.01, ***P < 0.001, and ****P < 0.0001; ns, not significant. Scale bars represent 5 µm in whole-cell images and 1 µm in insets.

