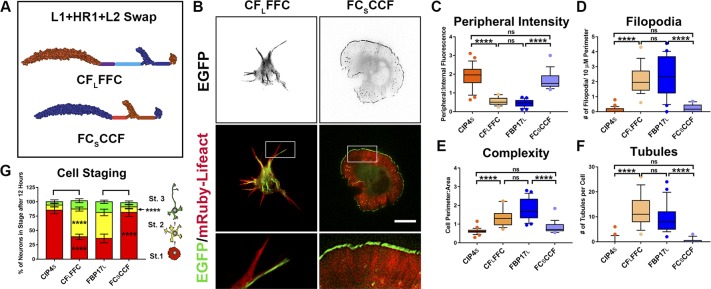
Figure S4. The middle domains of CIP4S and FBP17L determine their localization and function in cortical neurons.
(A) Schematic representation of the middle domain swaps CFLFFC and FCSCCF. (B) Images of living cortical neurons cotransfected with mRuby-Lifeact and either CFLFFC-EGFP or FCSCCF-EGFP. (C–F) Graphs showing quantification of stage 1 neurons comparing the effects of middle domain swaps on peripheral intensity (C), filopodia number (D), cell complexity (E), and tubule number (F). CIP4S-EGFP (n = 23 cells), CFLFFC-EGFP (n = 17 cells), FBP17L-EGFP (n = 24 cells), or FCSCCF-EGFP (n = 17 cells). (G) Stacked bar graph comparing the percentage of neurons in stage (st) 1, 2, and 3 for neurons expressing CIP4S-EGFP (n = 50) versus CFLFFC-EGFP (n = 54) and FBP17L-EGFP (n = 61) versus FCSCCF-EGFP (n = 52) at 12 h postplating. One-way ANOVA with Kruskal–Wallis post-test multiple comparisons. *P < 0.05, **P < 0.01, ***P < 0.001, and ****P < 0.0001; ns, not significant. Scale bars represent 5 µm in whole-cell images of neurons and 1 µm in insets.

