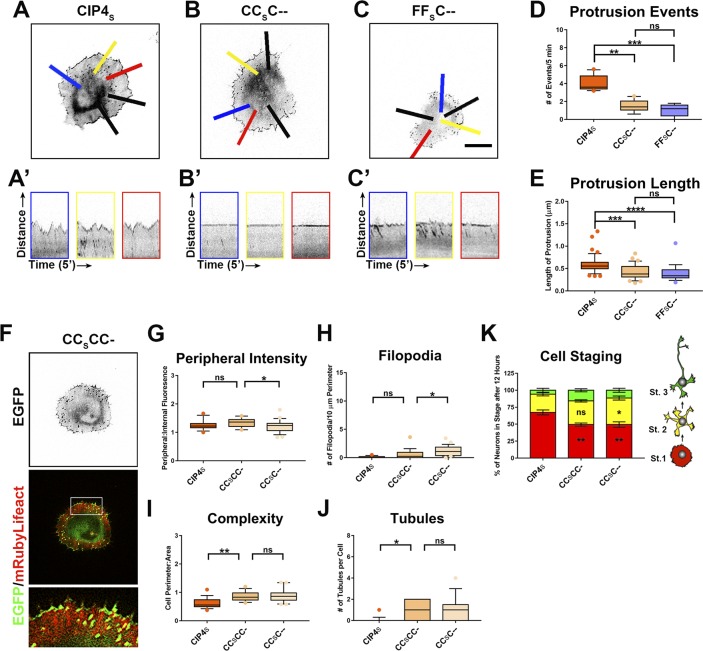
Figure S6. Deletion of the L2 and SH3 domains affect the function of CIP4S and CIP4S-like chimeras.
(A–C) Images of cortical neurons transfected with CIP4S-EGFP, CCSC--EGFP, or FFSC--EGFP. (A′–C′) Kymographs taken from the blue-, yellow-, and red-colored lines in (A–C). Each kymograph represents the relative movement (distance = 5.9 μm) of the membrane over a 5-min time-lapse. Scale bar in (C) represents 5 µm. Black lines in (A–C) indicate additional points of kymograph measurement. (D) Quantification of the average number of protrusion events (five lines per cell) per cell. CIP4S-EGFP (n = 10 cells), CCSC--EGFP (n = 10 cells), and FFSC—EGFP (n = 7 cells). (E) Average length of protrusion per cell. (F) Images of cortical neurons transfected with mRuby-Lifeact and CCSCC-EGFP. (G–J) Graphs showing quantification of stage 1 neurons comparing the effects SH3 deletion and L2+SH3 deletion on peripheral intensity (G), filopodia number (H), cell complexity (I), and tubule number (J). CIP4S-EGFP (n = 16 cells), CCSCC-EGFP (n = 19 cells), and CCSC--EGFP (n = 25 cells). One-way ANOVA with Kruskal–Wallis post-test multiple comparisons. (K) Stacked bar graphs comparing the percentage of neurons in stage (st) 1, 2, and 3 neurons expressing CIP4S-EGFP (n = 33), CCSCC- EGFP (n = 30), and CCSC--EGFP (n = 36) at 12 h postplating. Two-way ANOVA with Bonferroni post-test multiple comparison. *P < 0.05, **P < 0.01, ***P < 0.001, and ****P < 0.0001; ns, not significant.

