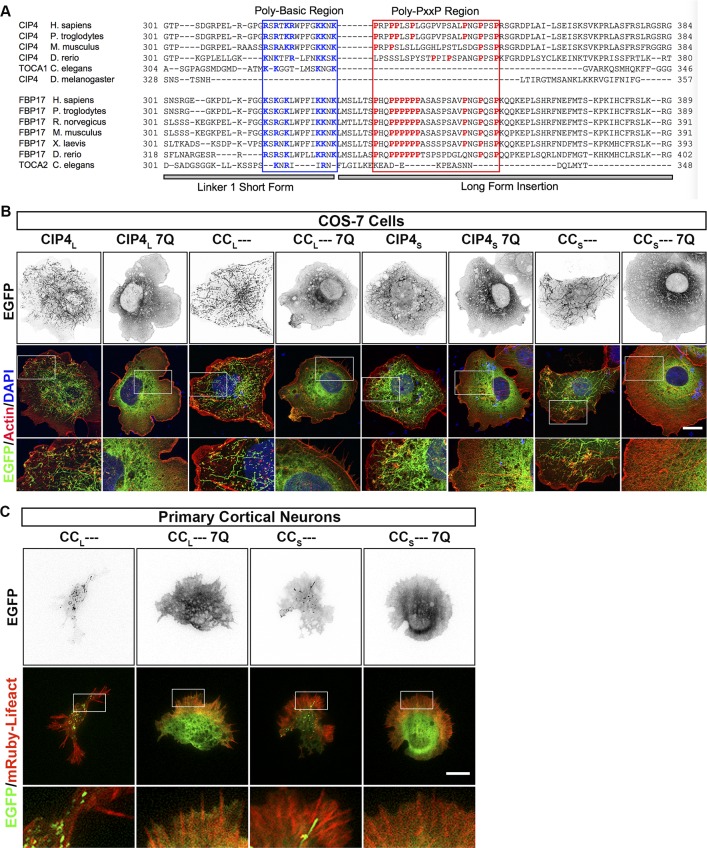
Figure S7. The polybasic region within the first linker region of CIP4 is responsible for F-BAR-dependent membrane tubulation.
(A) Multiple sequence alignments of CIP4 and FBP17 were performed with Clustal Omega (https://www.ebi.ac.uk/Tools/msa/clustalo/), followed by manual manipulation (accession numbers). CIP4Hs (NP_001275891.1), CIP4Pt (XP_016790317.1), CIP4Ms (NP_001229318.1), CIP4Dr (XP_017209563.1), TOCA1Ce (NP_741723.1), CIP4Dm (NP_001261412.1), FBP17Hs (AAI43514.1), FBP17 Pt (JAA43647.1), FBP17Rn (NP_620269.1), FBP17 Ms (NP_001171119.1), FBP17Xl (NP_001085826.1), FBP17Dr (NP_001116716.1), and TOCA2Ce (NP_499838.2). Basic residues within the PBR (blue box) are shown in blue and proline residues within the poly-PxxP region (red box) are shown in red. (B) Images of fixed COS-7 cells transfected with CIP4L-EGFP, CIP4L-7Q-EGFP, CCL---EGFP, and CCL---7Q-EGFP, CIP4S-EGFP, CIP4S-7Q-EGFP, CCS--- EGFP, and CCS---7Q-EGFP and labeled with phalloidin and DAPI. (C) Images of living cortical neurons transfected with mRuby-Lifeact and either CCL---EGFP, CCL---7Q-EGFP, CCS---EGFP, or CCS---7Q-EGFP. Scale bars represent 5 µm in whole-cell images of neurons and 1 µm in insets, and 15 μm in whole-cell images of COS-7 cells and 7 μm in insets.

