
Fig. 1.
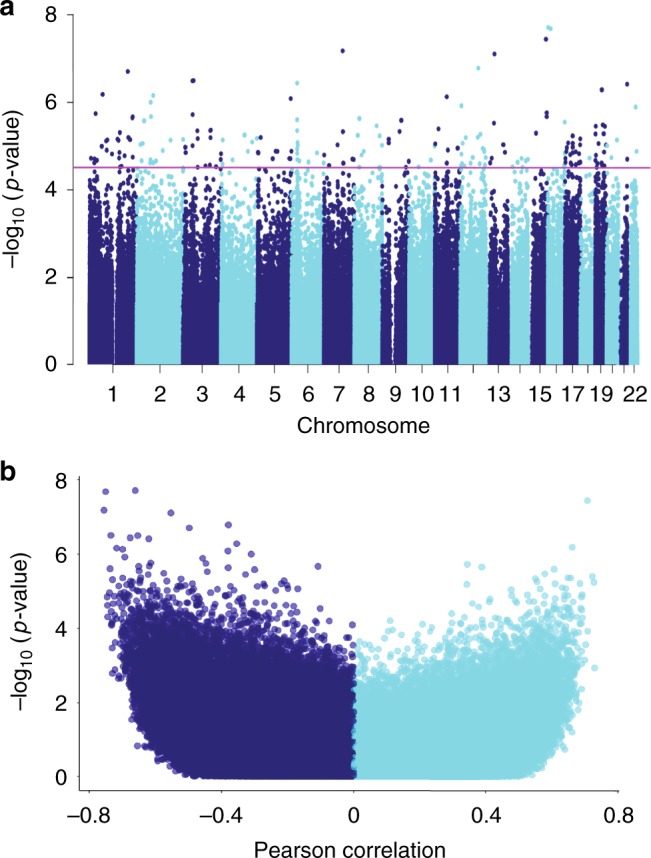
Association between cytosine methylation changes and interstitial fibrosis. a Manhattan plot of Interstitial Fibrosis associated methylation changes. The x-axis represents the genomic location of the probe, while the y-axis is the negative base 10 log of the p-value. (The association between the methylation level of 321,473 probes and kidney fibrosis was studied using a linear regression models adjusted for age, gender, race, diabetes, hypertension, batch, bisulfite conversion, and degree of lymphocytic infiltrate on histology. The threshold for genome-wide significance was set at p-value FDR < 0.05 as indicated by the horizontal magenta line). b Volcano plot depicting the association between Interstitial Fibrosis and methylation changes. The x-axis represents the Pearson correlation coefficient of each probe with Interstitial Fibrosis. The y-axis is the negative base 10 log of the p-value each probe associated with Interstitial Fibrosis