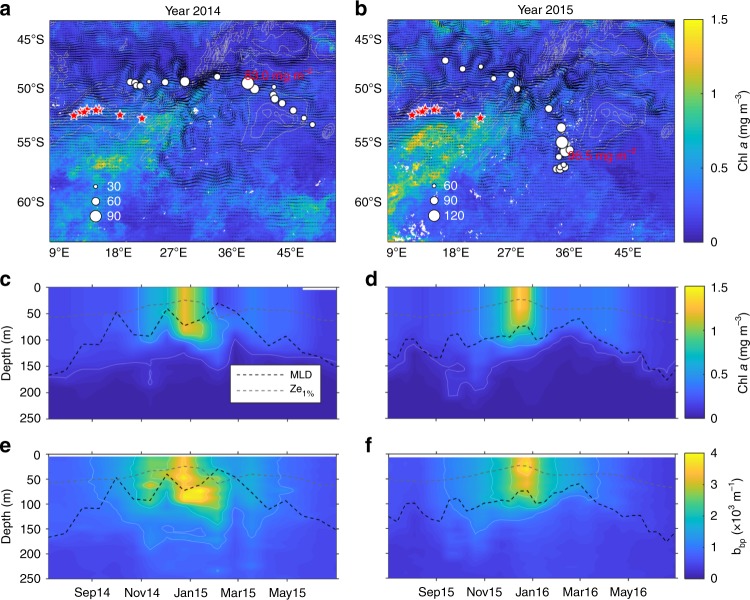
Fig. 2.
Massive phytoplankton blooms stimulated by upwelled hydrothermally influenced deep waters along the Southwest Indian Ridge (SWIR). Maps (a and b)of the SWIR in the Indian sector of the Southern Ocean and float trajectories. The maximum depth-integrated biomass (mg Chl m−2) is depicted according the size of the circles. Satellite-derived surface chlorophyll a climatologies (8-days GLOBcolour composite products) were retrieved from November to January a 2014–2015 and b 2015–2016. Black arrows correspond to altimetry-derived geostrophic velocities (AVISO MADT daily product) averaged over the same period. Gray lines represent the 2000, 3000 and 4000 isobaths. Time series of the 0–250 m vertical distribution of chlorophyll a (c and d) and backscattering (e and f) for the two BGC-Argo floats (WMO 6901585 and 2902130). The black and gray dashed lines are, respectively, representing the mixed layer depth (determined by a density-derived method with a density threshold of 0.03 kg m−3) and the euphotic zone depth (defined as the depth of 1% of surface irradiance according Morel et al.35; Eq. 10). The red stars indicate the position of hydrothermal vents from Tao et al.14

