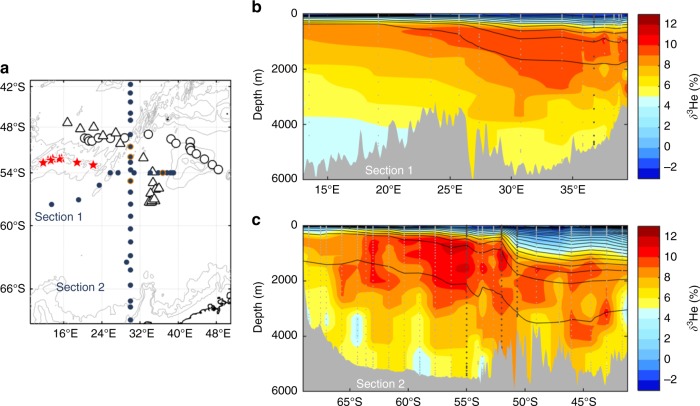
Fig. 3.
Hydrothermally influenced deep waters along the SWIR. Map (a) showing the locations of the bathymetry of the SWIR (contour levels: 2000, 3000, and 4000 m), the hydrothermal vents (red stars), the two BGC-Argo floats (black triangle dots: float WMO 6901585 and black circle dots: float WMO 2902130), and of the two sections (filled blue circle dots; b and c) of interpolated δ3He. Note that all the vertical δ3He profiles, where the surface eddy kinetic energy is high (EKE; >150 cm2 s−2), have been highlighted by additional orange circle dots in a and by darker gray in b and c

