Fig. 1.
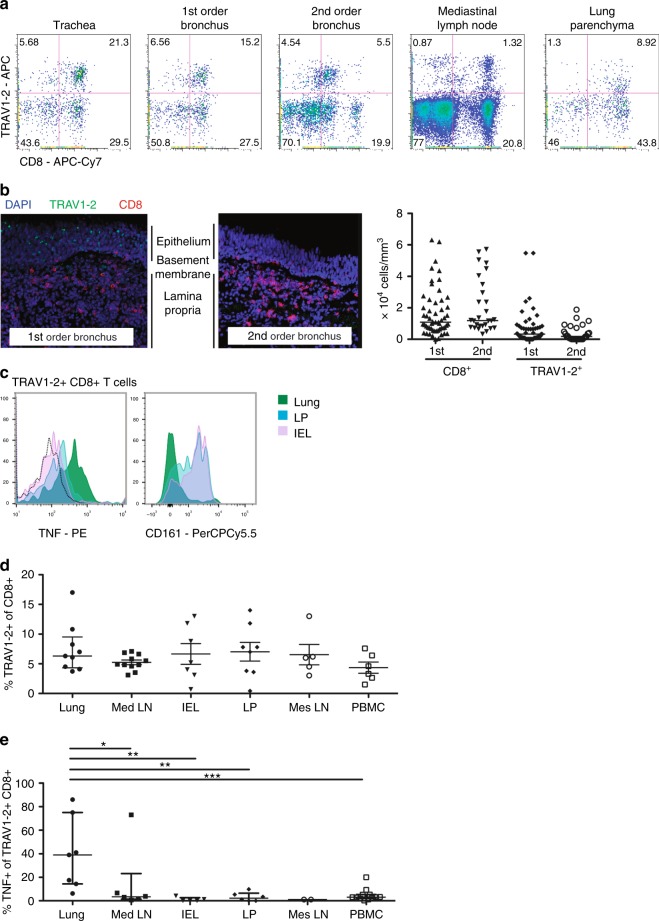
TRAV1-2+ CD8+ T cells from the lung but not the intestine of healthy organ donors respond to mycobacterial infection by producing TNF. a Dot plots showing the frequency of TRAV1-2+ CD8+ T cells among live CD3+ cells in the indicated tissue samples from one donor. b Tissue sections from the 1st and 2nd order bronchi were obtained from healthy individuals (n = 3 biologically independent samples). Immunohistochemistry was performed to quantify CD8+ (median 1.6 × 10⁴ vs. 2 × 10⁴ cells /mm3) and TRAV1-2+ cells (7,000 vs. 4,000 cells/mm3, Supplementary Data). Representative sections from 1st and 2nd order bronchi are depicted (left), showing CD8+ cells (red), TRAV1-2+ cells (green) and cell nuclei (DAPI; blue). c Histograms depicting TNF production (left) and CD161 expression (right) by TRAV1-2+ CD8+ T cells from matched lung parenchyma (green), small intestine lamina propria (LP; blue) and the small intestinal intraepithelial layer (IEL; violet) after overnight stimulation with M. smegmatis-infected antigen-presenting cells (dotted black line indicates the unstimulated control). d Frequency of TRAV1-2+ cells among CD8+ T cells from lung (n = 9 biologically independent samples), mediastinal lymph node (Med LN; n = 11 biologically independent samples), IEL (n = 7 biologically independent samples), LP (n = 8 biologically independent samples), mesenteric lymph node (Mes LN, n = 5 biologically independent samples), and peripheral blood (PBMC; n = 6 biologically independent samples, Supplementary Data). Medians and interquartile ranges are displayed. e Frequency of TNF-producing TRAV1-2+ CD8+ T cells after exposure to M. smegmatis-infected antigen-presenting cells: lung (n = 7 biologically independent samples), Med LN (n = 6 biologically independent samples), IEL (n = 5 biologically independent samples), LP (n = 6 biologically independent samples), Mes LN (n = 2 biologically independent samples), PBMC (n = 12 biologically independent samples, Supplementary Data). From top to bottom, P = 0.035, 0.0025, 0.0023 and 0.0005 (Mann–Whitney U test). Medians and interquartile ranges are displayed

