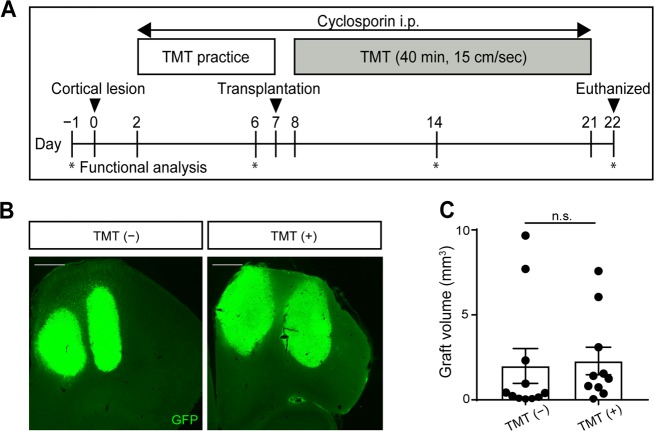
Fig. 2.
Schematic of the whole experiment and representative graft images. a Schematic of the whole experiment. b Representative coronal images of GFP staining at 2 weeks after cell transplantation without TMT (TMT (−) group) and with TMT (TMT (+) group). All specimens are shown in the section with maximum graft area. Scale bars, 500 µm. c Graft volume. There was no significant difference in graft volumes between groups. Mann–Whitney tests were performed; n = 11 in TMT (−) group and n = 10 in TMT (+) group. Data are presented as means ± SEM

