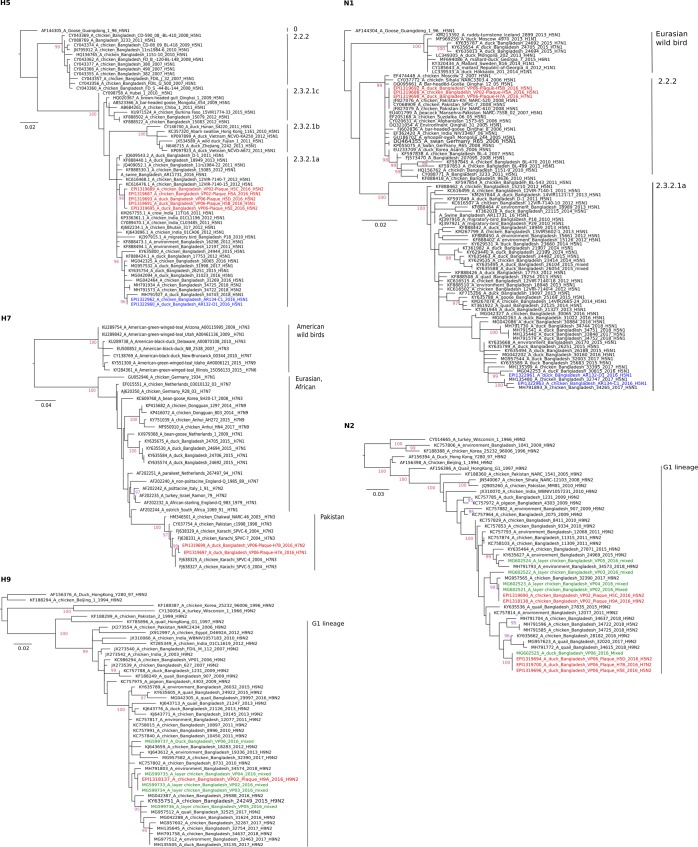
Figure 2.
Phylogenetic trees of HA H5, H7, H9, and NA N2 and N1 of sequences established from clinical samples (green) and plaque-purified viruses (red) from Tangail district. Sequences of samples from Mymensingh district are shown in blue. Maximum likelihood trees were established using the IQ-Tree software. Amino acid alignments of the HA1 and the full length NA proteins were used for calculation based on the specific FLU substitution model recommended by Dang et al.44. Robustness of branching orders was tested by an ultrafast bootstrap approximation algorithm38. Trees are drawn to scale and clading information is shown to the right of each tree.

