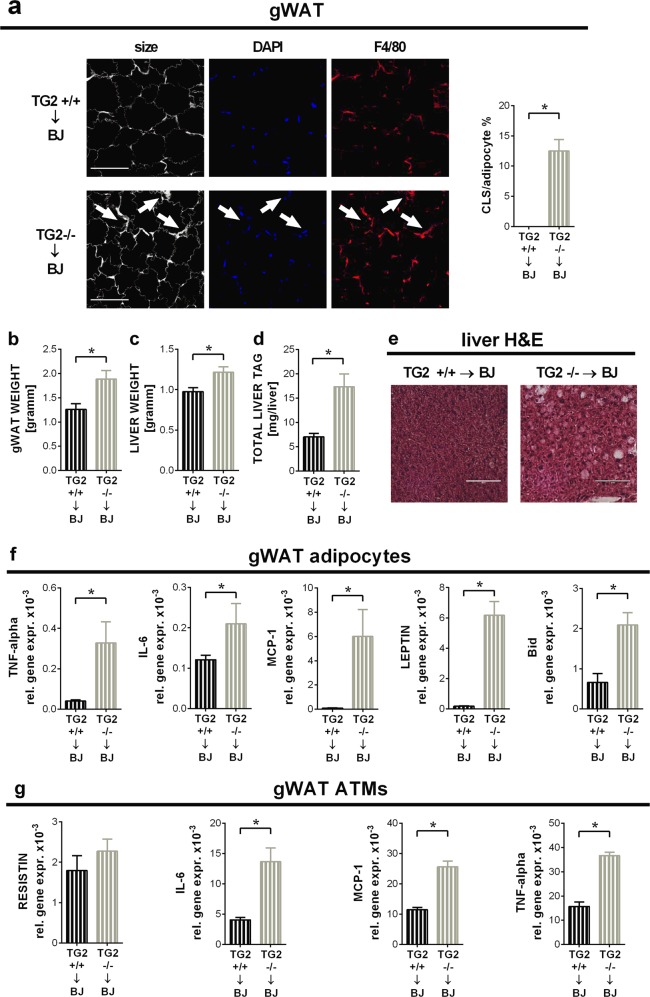
Fig. 2. Loss of TG2 in BMD cells promotes adipocyte cell death, inflammation and hepatic steatosis in mice fed on HFD.
a Confocal images of gWAT collected from BoyJ mice transplanted with the bone marrow of either TG2+/+ or TG2−/− mice at the end of the HFD feeding period. Paraffin-embedded gWAT slides were stained with the non-specifically labeling anti-digoxin antibody, anti-F4/80 antibody and DAPI to visualize adipocytes, macrophages, and nuclei under confocal microscopy. Scale bar, 100 μm. CLS cells in fields from randomly selected sections of three different mice in each group were quantified. Results are expressed as mean ± SD (n = 3 mice per group). Statistical significance was evaluated by 2-tailed unpaired Student’s t-test (*p < 0.05). b Weights of gWAT from the mice described in (a). c Liver weights from the same mice. d Liver triacylglycerol contents from the same mice determined from saponified, neutralized liver extracts by glycerol enzymatic assay. e Paraffin-embedded liver tissue slides from the same mice stained with H&E to visualize tissue architecture. One representative series of three are shown. Scale bar, 250 μm. f Inflammatory cytokine, leptin and Bid relative gene expression levels of gWAT adipocytes from the same mice determined by qRT-PCR using GAPDH as a reference gene. g Inflammatory cytokine and resistin relative gene expression levels of gWAT macrophages from the same mice determined by qRT-PCR using GAPDH as a reference gene. Results are expressed as mean ± SD (n = 8 mice per group). Statistical significance was evaluated by one-way ANOVA (*p < 0.05)

