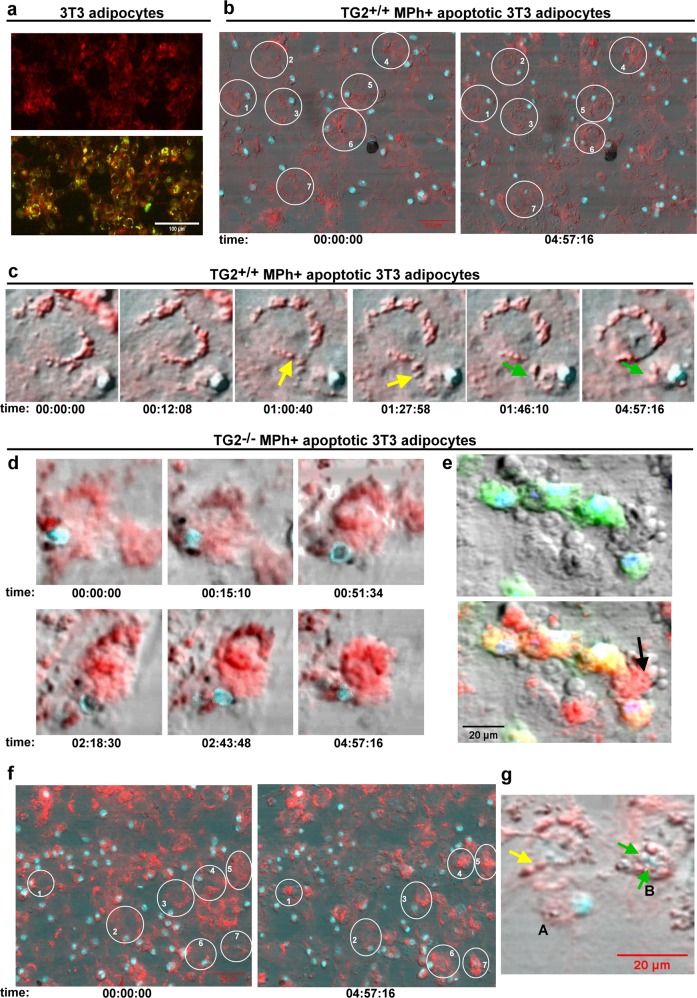
Fig. 3. Clearance of apoptotic adipocytes is faster by TG2 null macrophages than by their wild type counterparts.
a Apoptotic adipocytes form lipid-containing vesicles surrounded by phosphatidylserine positive membrane on their cell surface. Laser scanning cytometric image of apoptotic 3T3 adipocytes induced to die by serum withdrawal for 24 h and stained for lipids with Nile red (red) and for phosphatidylserine with FITC-labeled Annexin V (green). Scale bar, 100 μm. b 3T3 adipocytes induced to die by serum withdrawal for 24 h were stained for lipids with Nile red (red) and exposed to wild type BMDMs stained with vital Hoechst DNA dye for nuclei (blue). Apoptotic adipocyte clearance was followed for 5 h by laser scanning microscopy. First and last images from the Supplementary video 2 demonstrating the state of clearance for several apoptotic adipocyte/macrophage cell pairs at the end of the 5 h period. Please, note that apoptotic adipocytes shrink very slow (adipocyte 4 and 6) or not yet in the presence of wild type macrophages. c One apoptotic adipocyte and one wild type macrophage pair (from the Supplementary video 1) demonstrating the process of lysosomal exocytosis. 3T3 adipocytes induced to die by serum withdrawal for 24 h were stained for lipids with Nile red and exposed to wild type BMDMs stained with vital Hoechst DNA dye for nuclei (blue). Apoptotic adipocyte clearance was followed for 5 h by laser scanning microscopy. Yellow arrows indicate lipid-containing vesicle uptake by macrophages, green arrows point to vesicles already in the macrophage. The fact that the cytosol of macrophage contains red vesicles indicates lipid uptake from the adipocyte. d One apoptotic adipocyte and one TG2 null macrophage pair (from the video 3) demonstrating the process of the apoptotic adipocyte uptake by TG2 null macrophages. 3T3 adipocytes induced to die by serum withdrawal for 24 h were stained for lipids with Nile red and exposed to TG2 null BMDMs stained with vital Hoechst DNA dye for nuclei (blue). Apoptotic adipocyte clearance was followed for 5 h by laser scanning microscopy. Due to the fast vesicle uptake, the cytosol of the TG2 null macrophage is full with red vesicles making difficult to see the border between the adipocyte and the macrophage. Please, note apoptotic adipocyte cell membrane blebbing and the shrinkage of the adipocyte on the last image. e To visualize macrophages and adipocytes better, this is a laser scanning cytometric image of apoptotic 3T3 adipocytes induced to die by serum withdrawal for 24 h stained for lipids with Nile red and being engulfed by TG2 null BMDMs stained with vital Hoechst DNA dye for nuclei (blue) and CFDA for cytosol (green) after 4 h of phagocytosis. Upper panel shows the image without the red color of fat, lower panel shows all the colors together. Please note, that the green cytosol of BMDMs becomes yellow due to lipid uptake as the red and green colors overlap. Arrow indicates a shrinked blebbing adipocyte. Scale bar 20 μm. f 3T3 adipocytes induced to die by serum withdrawal for 24 h were stained for lipids with Nile red and exposed to TG2 null BMDMs stained with vital Hoechst DNA dye for nuclei (blue). Apoptotic adipocyte clearance was followed for 5 h by laser scanning microscopy. First and large images from the Supplementary video 4 demonstrating the state of clearance for several apoptotic adipocyte/macrophage cell pairs at the end of the 5 h period. Please, note that all the labeled adipocytes shrink and bleb. g After completing lysosomal exocytosis TG2 null macrophages engulf adipocyte nuclei. Laser scanning cytometric image of 3T3 adipocytes induced to die by serum withdrawal for 24 h stained for lipids with Nile red and exposed to TG2 null BMDMs stained with vital Hoechst DNA dye for nuclei (blue). At this stage of adipocyte clearance, the Hoechst slightly stains the adipocyte nucleus as well. Yellow arrow indicates the last lipid-containing vesicles’ uptake by macrophage A. Green arrows indicate nuclei taken up by macrophage B. Scale bar, 20 μm

