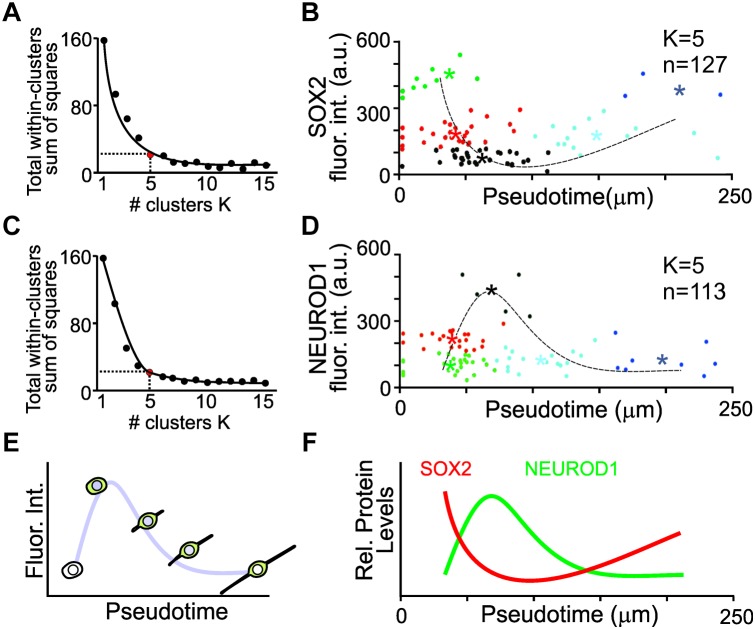
FIGURE 5.
K-means clustering and pseudotemporal analysis of iMOP-derived neurons. (A) Elbow test to identify the number of K clusters for SOX2 intensity measurements. Red point denotes the minimal number of clusters that represents the least variance in the data. (B) Clustering of cells (n = 127) into clusters (K = 5). Asterisks denote mean fluorescence intensity of SOX2 for each cluster and the dotted line represents curve fit for the measurements. (C) Elbow test for NEUROD1 intensity measurements. (D) Clustering of cells (n = 113) into distinct populations (K = 5). Asterisks represent mean fluorescence intensity of NEUROD1 for each cluster with the curve fit represented by the dotted line. (E) Curve fit of the mean fluorescence intensity in pseudotemporal ordered cells represents the dynamics of protein expression. Measurements of cells were obtained from a total of n = 5 individual experiments. (F) Summary of SOX2 and NEUROD1 protein expression dynamics after pseudotime analysis.

