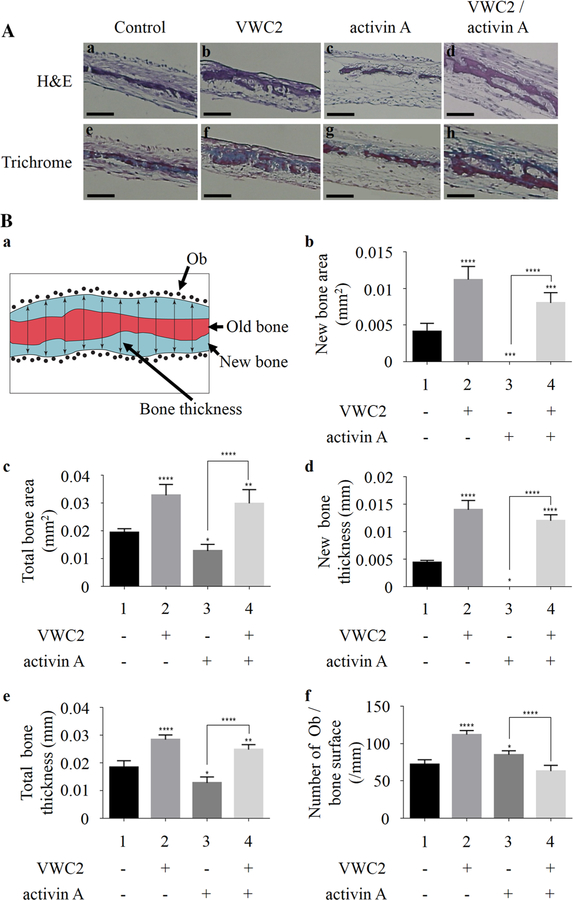
Fig. 4.
Effect of VWC2 on calvarial bone formation. Calvarial bones were dissected from C57BL/6 neonates at P7, cultured, and treated with PBS (control), VWC2 (500 ng/ml), activin A (250 ng/ml), or both VWC2 and activin A. Paraffin-embedded sections were stained with H&E or Masson Trichrome staining. A The representative image of H&E staining (a–d) or Trichrome staining (e–h) per treatment group was shown. Scale bar, 0.2 mm. B Quantitative histomorphometric analysis. a Schematic image of the representative calvarium section by Trichrome staining. The blue area represents new bone area; the red area represents old bone area; each black dot represents an osteoblast (Ob) counted on both the endosteal and periosteal surfaces of the calvarium; the double headed arrows across the section represent thickness determinations by performing 10 equally spaced linear measures across the field of view.b–f Effects of VWC2, activin A, and VWC2/activin A on murine neonatal calvarial bone organ cultures were analyzed by measuring new bone area (b), total bone area (c), new bone thickness (d), total bone thickness (e), and number of osteoblast (Ob)s per bone surface (f) (n = 5 per treatment group). ****P value < 0.0001, ***P value < 0.001, **P value < 0.01, *P value < 0.05

