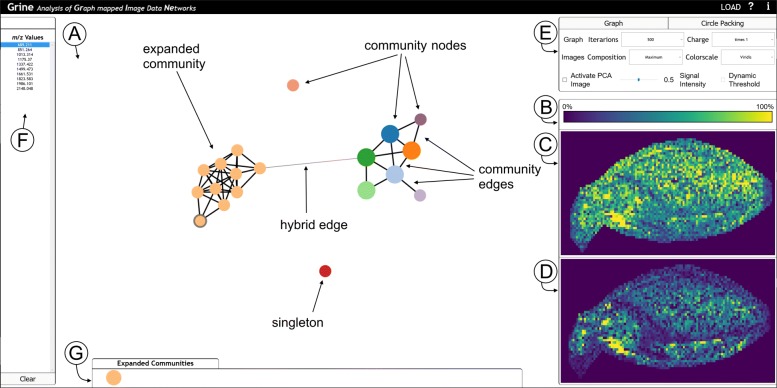
Fig. 3.
GRINE UI with graph mode active and hierarchy mode (circle packing) inactive. One community of the whole community-graph G′, which is shown in (a), is expanded and the m/z-node of m/z-value 689.211 is selected. (A) Network display in graph mode. (b-d) Image Display. b Legend for color scheme (in this case: viridis). c Community-map. dm/z-image. e Options box to configure the graph, image and hierarchy mode. f List of all m/z-values or, if selected, of all m/z-values in the selected community. g Expanded communities

