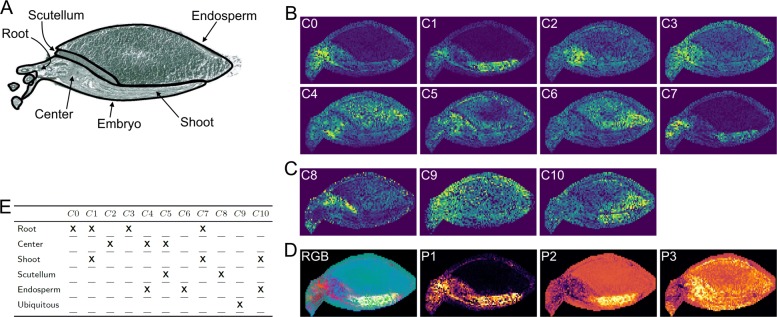
Fig. 5.
a Optical image scan with marked and labeled anatomical structures. b Average community-maps of all (n)–communities, with n>1 (network in Additional file 1: S4). c Images of (1)–Communities (network in Additional file 1: S4). d RGB image of the first three PCA projections, where the projections on the eigenvectors of the first, second and third largest eigenvalue is assigned to the red, green and blue channel, respectively and standalone images of these components. PCA images are not scaled like the community-maps and m/z-images. The color map viridis is used for images in (b) and (c) and inferno for images in (d). e Correlation between the spatial signal distributions of all found communities and the anatomical structures of the barley seed. X indicates that a community shows increased signal in the respective area

