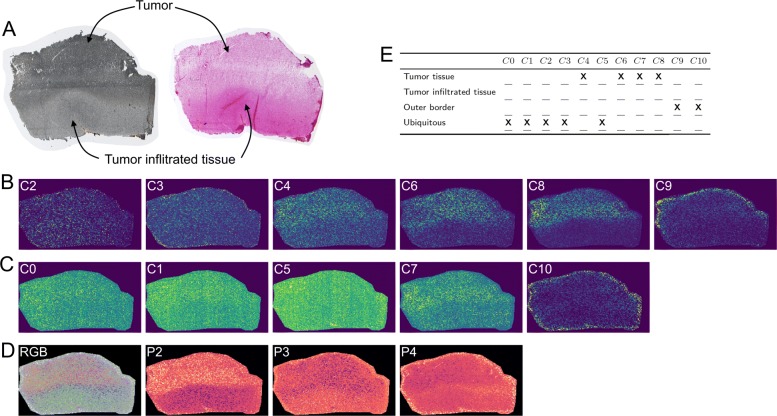
Fig. 7.
a Optical image scan of the sample used for MALDI analysis (left) and H&E stained image scan of the subsequent sample section (right). For the H&E stained image lighter color indicates tumor tissue and darker color indicates tumor infiltrated tissue, while this is reversed for the optical image. b Average community-maps of all (n)–Communities, with n>1 (network in Additional file 1: S4). c Images of (1)–Communities (network in Additional file 1: S4). d RGB image of the second, third and fourth PCA components, where the projections on the eigenvectors of the second, third and fourth largest eigenvalue is assigned to the red, green and blue channel, respectively and standalone images of these components. PCA was done without the additional preprocessing steps of data squaring and image thresholding. The PCA images are not scaled like the community-maps and m/z-images. The color map viridis is used for images in (b) and (c) and magma for images in (d). e Allocation of the spatial signal distribution of all found communities to specific pattern within the glioblastoma sample. We determine three main areas: Tumor tissue, tumor infiltrated tissue and outer border. X indicates that a community shows increased signal in the respective area

