Fig 2.

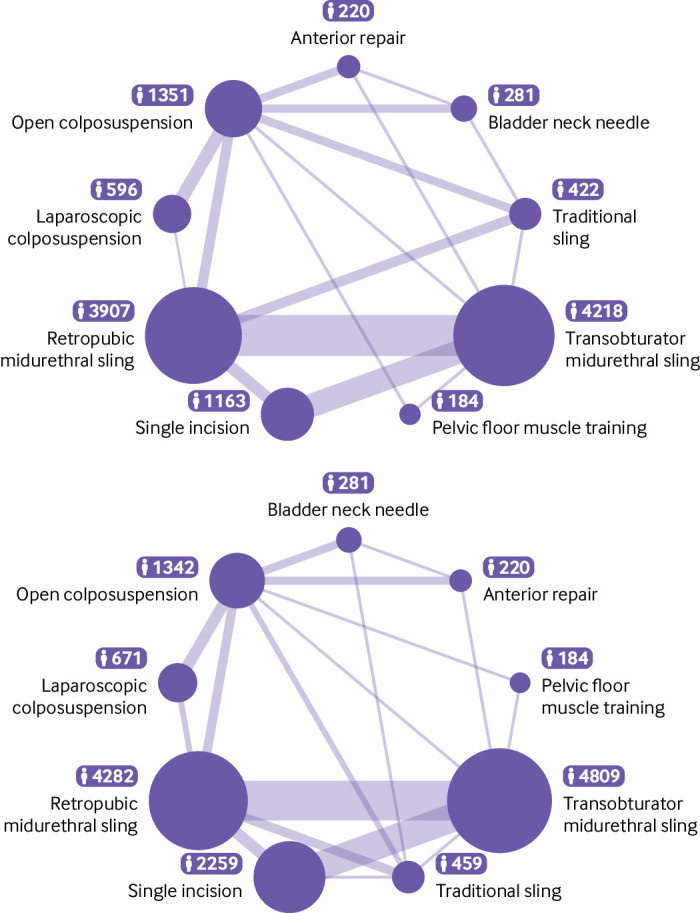
Network plot for number of women showing cure (top panel) and improvement (bottom panel) of stress urinary incontinence symptoms. Circle size reflects number of women and line width reflects number of direct comparisons

Network plot for number of women showing cure (top panel) and improvement (bottom panel) of stress urinary incontinence symptoms. Circle size reflects number of women and line width reflects number of direct comparisons