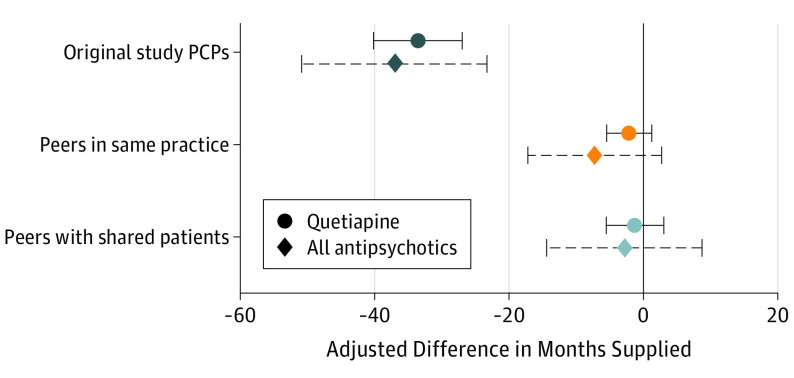
Figure 2. Association of Intervention With Antipsychotic Prescribing by Original Study Primary Care Physicians (PCPs) and Peers During 2015 and 2016.
Points show the difference in average months of antipsychotics supplied between treatment and control PCPs in the original study and between treatment and control peers of original study PCPs during 2015 and 2016. Each point reports an adjusted difference (the difference between treatment and control means after adjusting for control variables). All estimates were adjusted for months of antipsychotics supplied in 2014 to raise statistical power. Because peers who were linked to more original study PCPs were more likely to be considered treated, peer estimates were adjusted for the number of original study PCPs with whom peers were associated (indicators for each value are included in the regression model). Error bars are 95% confidence intervals and use randomization inference to account for the correlation across peers due to the network structure of treatment.

