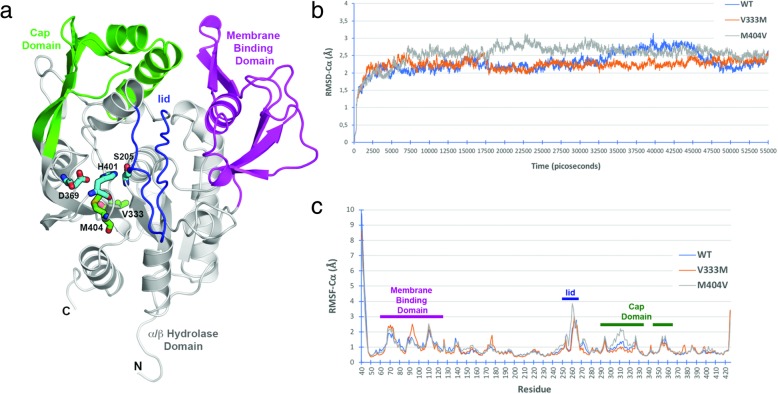
Fig. 2.
Molecular Dynamics Simulations of wild-type and variant LCAT. a Schematic representation of human LCAT (40–425) indicating important functional regions for activity and position of reported variants. b Root-mean square deviation of alpha carbons (RMSD-Cα) for WT and variant proteins during molecular dynamics. c Root-mean square fluctuation of alpha carbons (RMSF-Cα) for WT and variant proteins during molecular dynamics. Functional regions are depicted as bars with the color corresponding to panel “a”

