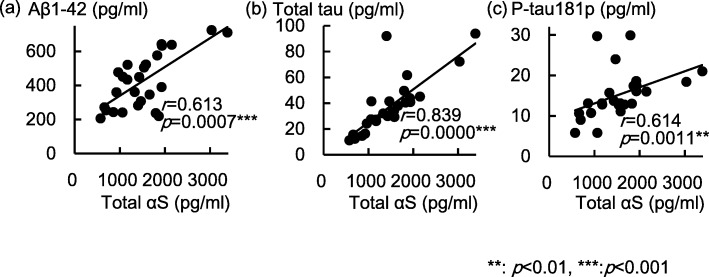
Fig. 2.
Distribution of CSF levels of total α-synuclein and CSF protein levels. The graphs show CSF levels of total αS with CSF levels of a Aβ1–42, b total tau, and c P-tau181p. Abbreviations: Total αS, Total α-synuclein; Aβ1–42, amyloid β (Aβ)1–42; P-tau181p, tau phosphorylated at threonine 181; O-αS, oligomeric α-synuclein

