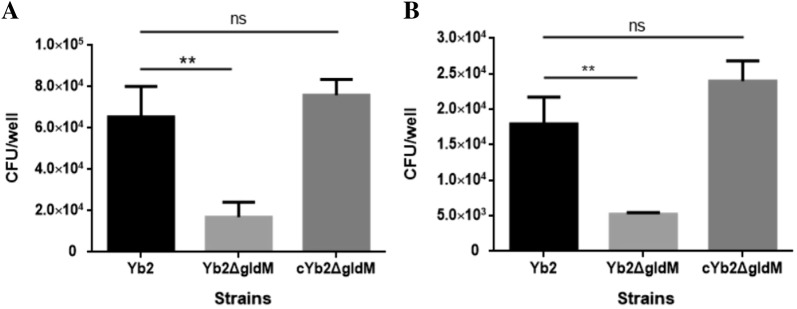
Figure 5.
Bacterial adherence (A) and invasion (B) assays. The assays were performed on Vero cells, and the cells were infected with each strain at a MOI of 50. The data represent the counts of bacteria bound to or having invaded Vero cells in each well of a 24-well plate. The data are presented as the means ± standard deviations of three independent experiments (**p < 0.01; ns, p > 0.05).

