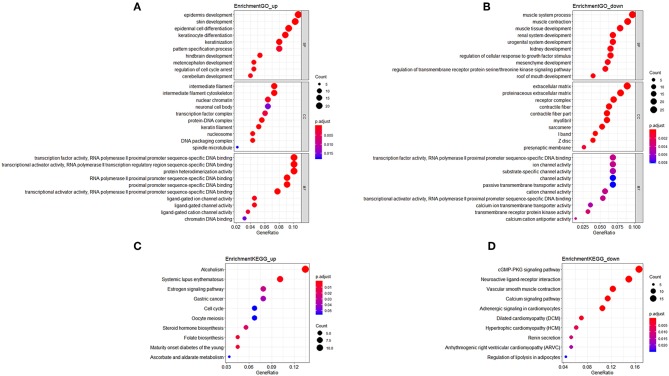
Figure 1.
Functional enrichment analysis of mRNAs in the ceRNA network. (A) Gene Ontology enrichment analysis of upregulated mRNAs. (B) Gene Ontology enrichment analysis of downregulated mRNAs. (C) KEGG pathway analysis of upregulated mRNAs. (D) KEGG pathway analysis of downregulated mRNAs. Horizontal axis represents gene count. Vertical axis represents enrichment analysis terms. Color of each plot represents the p value while the size represents the gene number in this term.

