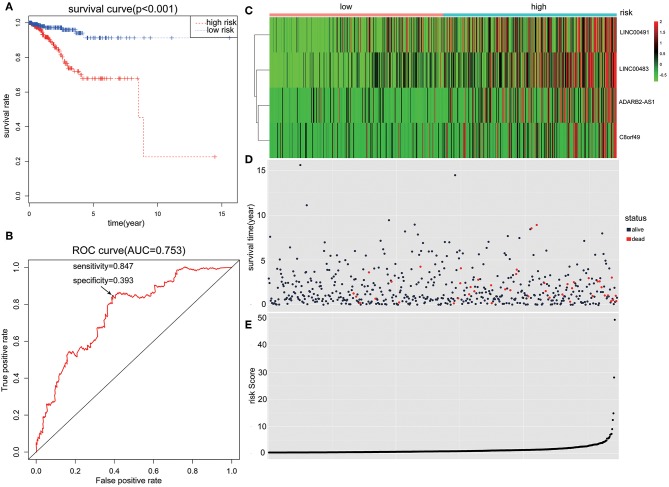
Figure 3.
The predictive value of the risk score calculated by LINC00491, LINC00483, ADARB2-AS1, and C8orf49. (A) Kaplan-Meier survival analysis of the risk score for overall survival. Log-rank test was used to compare the survival distribution of these two groups. (B) ROC for the prediction of the 3-years survival based on risk score. Area under the curve is 0.753, the sensitivity and specificity are 0.847 and 0.393 respectively. (C) Heatmap of LINC00491, LINC00483, ADARB2-AS1, and C8orf49 in high-risk and low-risk groups. The color of each block represents the relative expression of lncRNA in this patient. (D) Survival status and survival time of each individual. Color of each plot represents the survival status of each patient. (E) Risk score of each individual.

