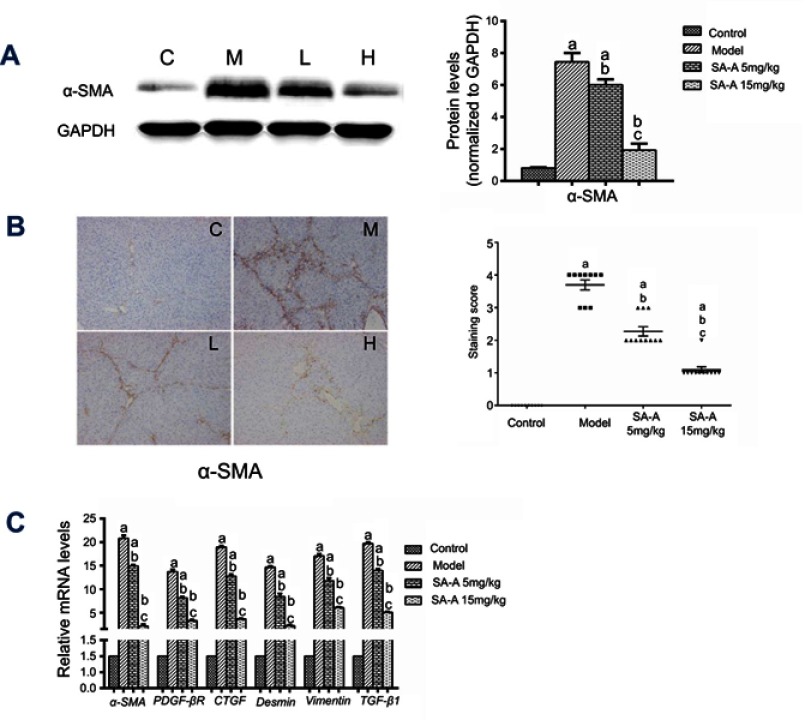
Figure 3.
SA-A inhibits HSCs activation to prevent liver fibrosis. (A) Effects of SA-A on the expression of a-SMA in the liver tissues were measured by western blot analysis. (B) Immunohistochemistry staining of a-SMA in the liver tissues, magnification: ×100. (C) Relative mRNA levels of α-SMA, PDGF-βR, CTGF, Desmin, Vimentin, and TGF-β1. Data are expressed as the mean ± S.D.. aP<0.05 as compared with control (C) group, bP<0.05 as compared with model (M) group, cP<0.05 as compared with SA-A 5 mg/kg (L) group.
Abbreviations: HSCs, hepatic stellate cells; SA-A, salvianolic acid A.

