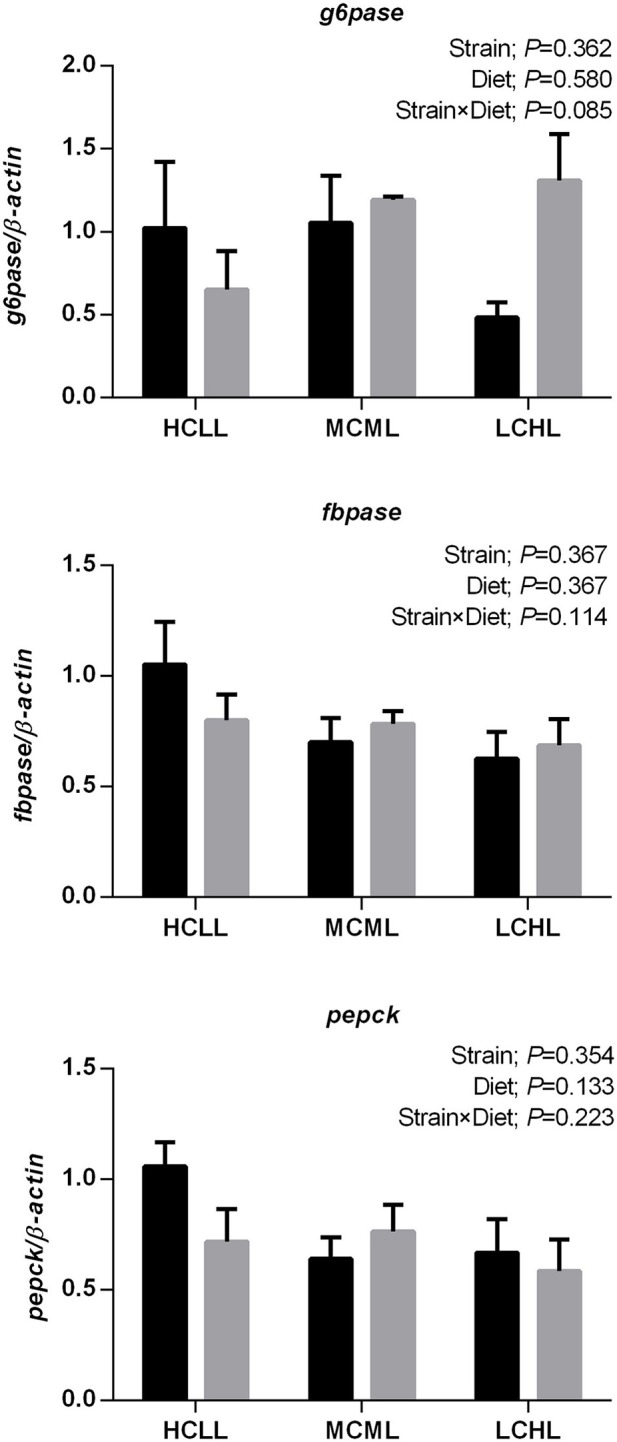
Figure 2.

Gene expression levels of selected gluconeogenesis enzymes in the liver of the A strain (black bars) and the F strain (gray bars) fed the HCLL (High Carbohydrate Low Lipid, 45% carbohydrate, 2% lipid), MCML (Medium Carbohydrate Medium Lipid, 30% carbohydrate, 8% lipid), or LCHL (Low Carbohydrate High Lipid, 15% carbohydrate, 14% lipid) diet. Measurements were taken 8 h after the last feeding. Glucose-6-phosphatase (g6pase), fructose 1,6-bisphosphatase (fbpase), and phosphoenolpyruvate carboxykinase (pepck) mRNA levels were measured using real-time quantitative RT-PCR. Results represent the mean ± s.e.m (n = 6). Significance was determined using a two-way ANOVA (P < 0.05), followed by the Student-Newman-Keuls multiple comparison test.
