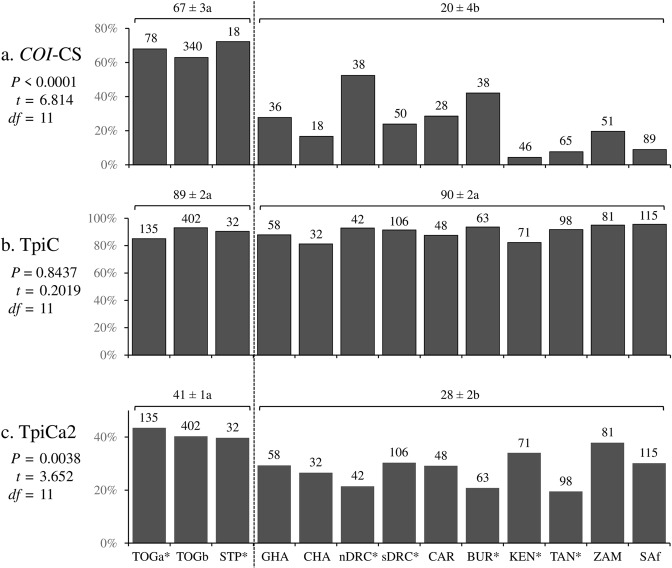
Figure 2.
Comparisons of COI and Tpi haplotype frequency in 13 fall armyworm collection sets, including seven from a previous study36 (*). The Togo and São Tomé and Príncipe collections were compared with that from the rest of Africa by two-tailed t-test analysis. The mean percent ± standard deviation is indicated over the horizontal bars, with different lower-case letters indicating statistical significance. (a) Frequency of the COI-CS strain diagnostic marker based on analysis of the COIB segment. Number of specimens indicated above columns. (b) Frequency of the TpiC strain diagnostic marker from the TpiE4 exon segment adjusted for the contribution of heterozygotes. Estimated number of chromosomes tested indicated above columns. (c) Frequency of the TpiCa2 variant from the TpiE4 exon segment adjusted for the contribution of heterozygotes. Estimated number of chromosomes tested indicated above columns.

