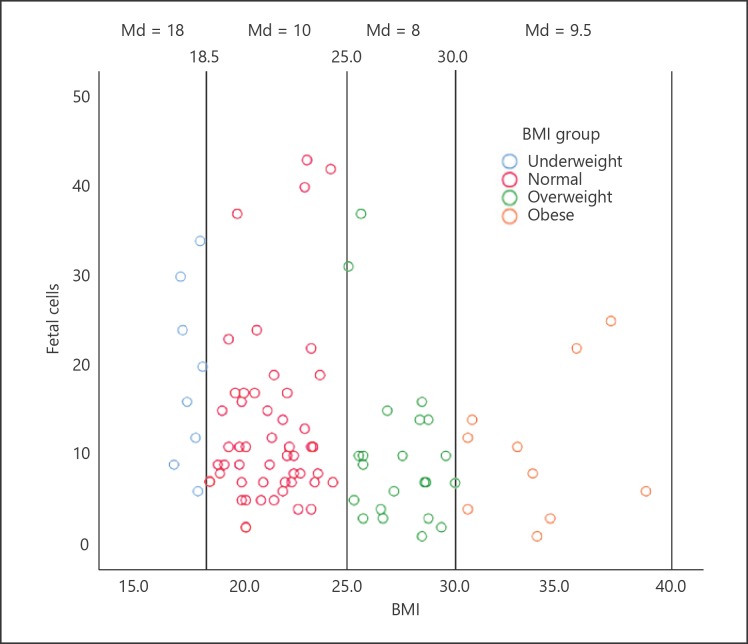
Fig. 1.
The scatter plot shows the distribution of fetal cells in 91 pregnant women. Each BMI subgroup is marked with a vertical line. Extreme values of fetal cell numbers are more frequent in the underweight and normal weight group, and a decrease in the number of fetal cells trends with an increasing BMI. Md, median.

