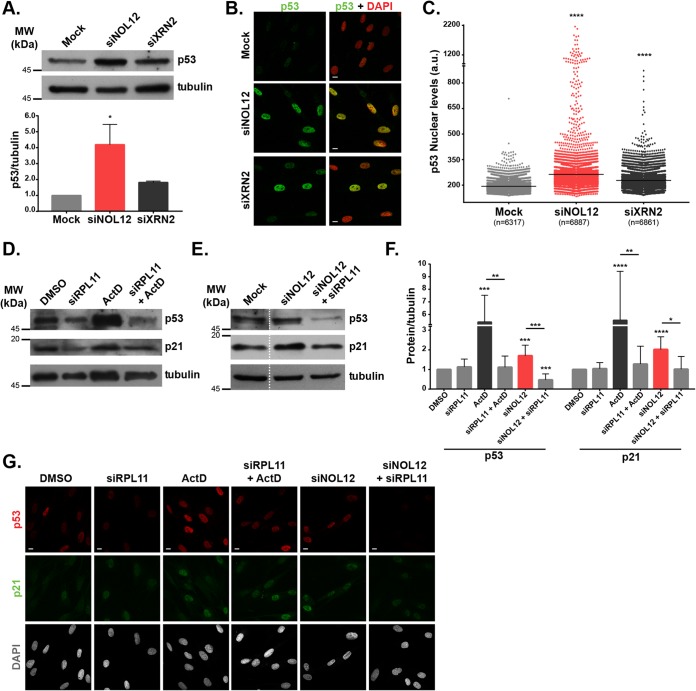
FIG 2.
NOL12 repression activates the p53-signaling pathway in an RPL11-dependent manner. (A) Western blotting of p53 levels in cell extracts from mock-, siNOL12-, and siXRN2-treated neonatal dermal fibroblasts. Tubulin protein levels were used as the loading control. In the graph, bars show mean values ± SD from three independent experiments, normalized to the values for the mock-treated control. *, P ≤ 0.05, by Kruskal-Wallis statistical test. (B) p53 immunostaining (green) of mock-, siNOL12-, and siXRN2-treated human fibroblasts. DNA was stained with DAPI (red). Scale bars, 10 µm. (C) Scatter plot of mean p53 nuclear pixel intensity levels in mock-, siNOL12-, and siXRN2-treated cells. Each dot represents the value for a single cell, and horizontal lines represent the mean values. n = total number of cells analyzed. ****, P ≤ 0.0001, by Kruskal-Wallis statistical test. (D) Western blotting of p53 and p21 protein levels in cell extracts from control or siRPL11-depleted fibroblasts, untreated or treated with 8 nM actinomycin D for 4 h, as indicated. Tubulin was used as the loading control. (E) Western blotting of p53 and p21 protein levels in cell extracts from mock-, siNOL12-, and siNOL12+siRpL11-treated fibroblasts. Tubulin was used as the loading control. (F) p53 and p21 protein levels measured by Western blotting (as shown in panels D and E) from four independent experiments. Bars represent mean values ± SD, normalized to the values for the tubulin loading control and the dimethyl sulfoxide (DMSO)-treated control. *, P ≤ 0.05; **, P ≤ 0.01; ***, P ≤ 0.001; ****, P ≤ 0.0001, by Mann-Whitney statistical test. (G) Immunostaining of p53 (red) and p21 (green) in control, siRpL11-, siNOL12-, and siNOL12+siRpL11-treated fibroblasts, untreated and treated with 8 nM actinomycin D for 4 h. DNA was stained with DAPI (gray). Scale bars, 10 µm.

