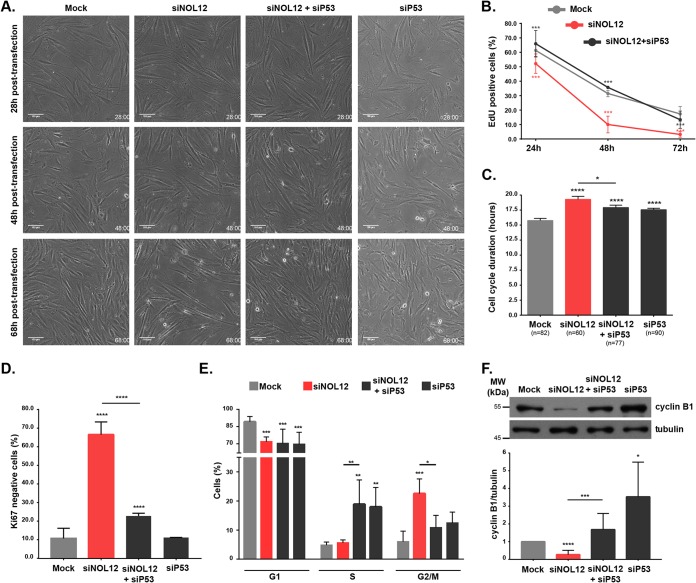
FIG 3.
NOL12 repression induces p53-dependent G2 arrest. (A) Long-term phase-contrast live-cell imaging of mock-, siNOL12-, siP53-, and siNOL12+siP53-treated fibroblast cell cultures. Representative images captured in movies taken at 28, 48, and 68 h posttransfection are shown. Scale bars,100 µm. (B) Percentages of mock-, siNOL12-, and siNOL12+siP53-treated cells staining positive upon EdU incorporation at 24, 48, and 72 h posttransfection. Data are mean values ± standard errors of the means (SEM) from three independent experiments. ***, P ≤ 0.001, by χ2 statistic test. (C) Cell cycle duration, measured as the interval between mother cell mitosis and daughter cell mitosis, in mock-, siNOL12-, siP53-, and siNOL12+siP53-treated fibroblast cell cultures. Values are means ± SEM; n = total number of cells analyzed. *, P ≤ 0.05; ****, P ≤ 0.0001, by Mann-Whitney statistical test. (D) Percentages of cells staining negative for the proliferation marker Ki67 in mock-, siNOL12-, siP53-, and siNOL12+siP53-treated cell cultures. Values are means ± SD from at least two independent experiments. ****, P ≤ 0.0001, by χ2 statistical test. (E) Percentages of cells in G1, S, and G2/M cell cycle phases in mock-, siNOL12-, siP53-, and siNOL12+siP53-treated fibroblast cultures as determined by flow cytometer cell cycle profiling. Values are means ± SD from three independent experiments. *, P ≤ 0.05; **, P ≤ 0.01; ***, P ≤ 0.001, by two-way ANOVA statistical test. (F) Western blot analysis of cyclin B1 levels in cell extracts from mock-, siNOL12-, siP53-, and siNOL12+siP53-treated neonatal fibroblasts. Tubulin levels were used as the loading control, and cyclin B1 levels were normalized to those of mock controls. Values are means ± SD from at least seven independent experiments. *, P ≤ 0.05; ***, P ≤ 0.001; ****, P ≤ 0.0001, by Mann-Whitney statistical test.

