FIG 5.
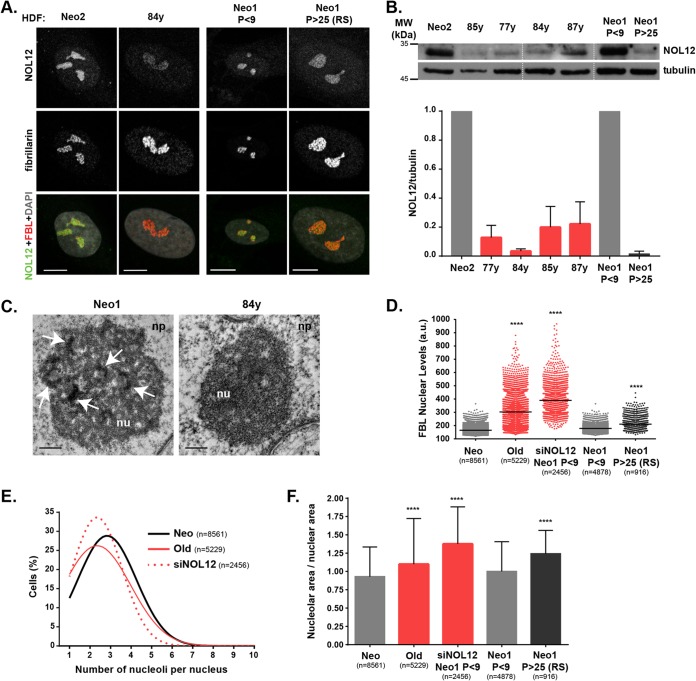
NOL12 repression and nucleolar stress in human fibroblasts from elderly donors. (A) Immunofluorescence analysis of NOL12 (grayscale/green) and fibrillarin (grayscale/red) levels in human primary dermal fibroblasts (HDFs) from neonatal (Neo2) versus 84-year-old (84y) donors, and low-passage (P)-number (P < 9) versus high-passage-number (P > 25; RS, replicative senescence) neonatal fibroblasts (Neo1). DNA was stained with DAPI (gray). Scale bars, 10 µm. (B) Western blot analysis of NOL12 protein levels in cell extracts from HDFs from neonatal (Neo2) and 85-, 77-, 84-, and 87-year-old donors, as well as from low- and high-passage-number neonatal fibroblasts (Neo1, P < 9, and Neo1, P > 25, respectively). Tubulin was used as the loading control. In the graph, values are means ± SD from two independent experiments, normalized to the values for Neo2 (all red bars) or Neo1 (dark gray bar). (C) Ultrastructural analysis of nucleoli from neonatal and 84-year-old donors by transmission electron microscopy. Representative micrographs, at ×30,000 and ×50,000 magnification, respectively, are shown. Arrows indicate FC/DFC units. Scale bars, 0.5 µm. np, nucleoplasm; nu, nucleolus. (D) Scatter plot shows the mean pixel intensities of fibrillarin nuclear levels in cells from neonatal (Neo1 and Neo2) and elderly (Old; 77-, 84-, 85-, and 87-year-old) donors and NOL12-repressed (siNOL12) and neonatal low- and high-passage-number (Neo1 P < 9 and Neo1 P > 25) cells. Each dot represents the value for a single cell. Horizontal lines represent the mean values. ****, P ≤ 0.0001, by Kruskal-Wallis statistical test. (E) Distribution curves for the total numbers of nucleoli per cell in fibroblast cultures from neonatal (Neo1 and Neo2), elderly (Old; 77-, 84-, 85-, and 87-year-old), and NOL12-repressed (siNOL12) donors. (F) Ratios between nucleolar and nuclear areas in cells from neonatal (Neo1 and Neo2), elderly (Old; 77-, 84-, 85-, and 87-year-old), NOL12-repressed (siNOL12), and neonatal donors at low and high passage numbers (Neo1, P < 9, and Neo1, P > 25, respectively). Values are means ± SD normalized to the value for Neo (red bars) or Neo1 (dark gray bar). ****, P ≤ 0.0001, by Kruskal-Wallis statistical test. RS, replicative senescence.

