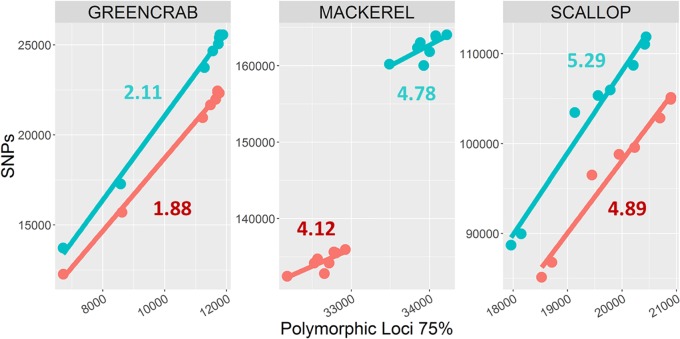
FIGURE 3.
Numbers of shared polymorphic loci and derived SNPs. Dots represent catalogs built using M = 2, n = 3 (blue), and M = 4, n = 6 (red) combinations. Each color includes eight dots, corresponding to m = 2, m = 3, m = 4, and m = 5, and PCR clone filtered/non-filtered catalogs. Numbers represent average number of SNPs per shared polymorphic loci in M = 2, n = 3 (blue) and M = 4, n = 6 (red) catalogs.

