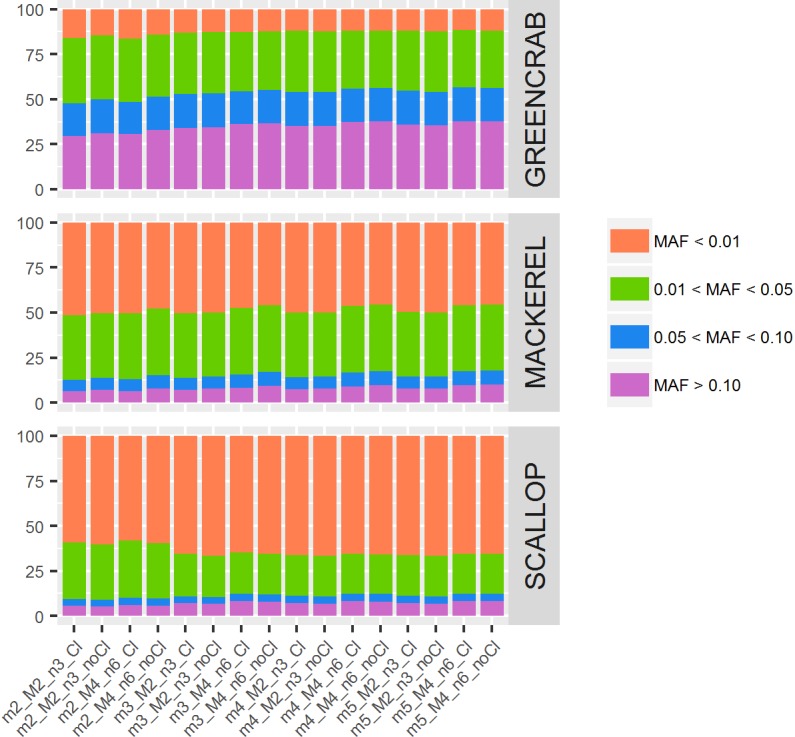
FIGURE 4.

Percentage of SNPs for each MAF value range. Colored bars represent percentages of SNPs per MAF value range: orange bars indicate MAF below 0.01; green bars, MAF between 0.01 and 0.05; blue bars, MAF between 0.05 and 0.10; and purple bars, MAF higher than 0.10. Each column represents a different catalog, obtained with different values of m, M, and n, before (Cl) and after (noCl) filtering PCR clones.
