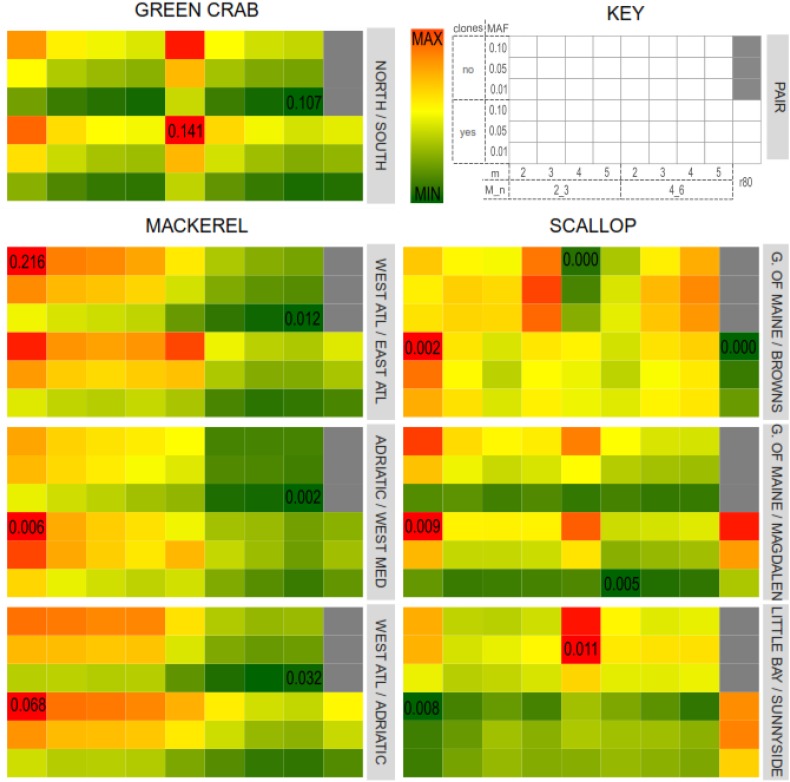
FIGURE 5.
Average pairwise FST values for each catalog and population pairs for the three datasets: Northern/Southern green crab locations; Western/Eastern Atlantic Ocean, Adriatic Sea/Western Mediterranean Sea (intra-Mediterranean) and Western Atlantic/Adriatic Sea mackerel populations; Gulf of Maine/Magdalen Islands (northern/southern locations), Little Bay/Sunnyside (intra-North) and Gulf of Maine/Browns Bank (intra-South) scallop locations. Color gradients represent FST values, from lowest (dark green) to highest (dark red). Minimum and maximum FST values for each pair are indicated in the corresponding cell.

