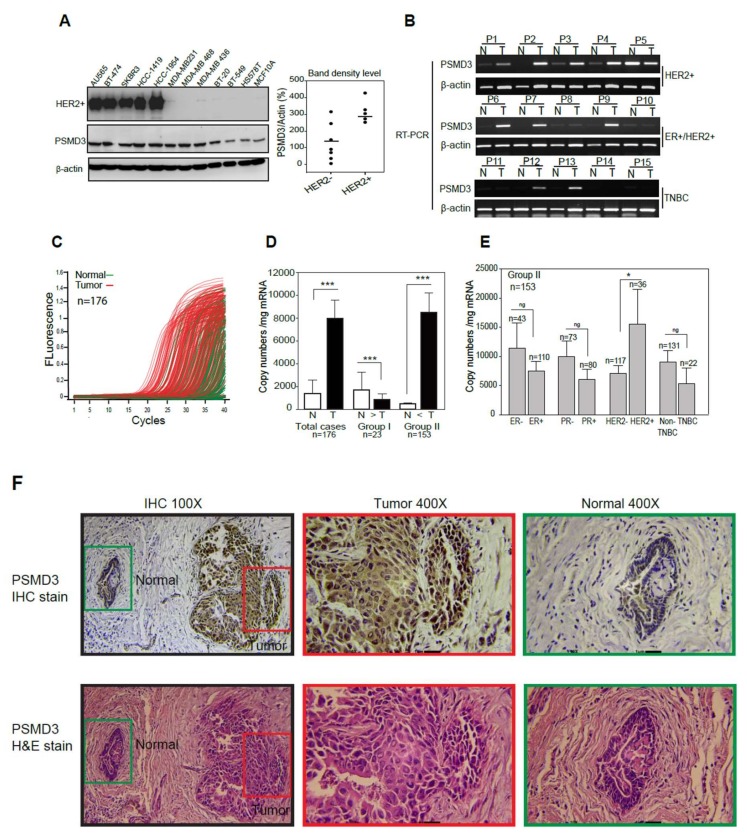
Figure 1.
Detection of Proteasome 26S subunit, non-ATPase 3 (PSMD3) expression level in normal and malignant breast cancer (BC) cell lines and human BC tissues. (A) PSMD3 expression at protein level in Human epidermal growth factor receptor 2 (HER2) positive versus HER2 negative were detected by Western blot; normal (MCF10A) and cancerous human breast cell lines (Au565, BT-474, SKBR3, HCC-1419, HCC-1954, MDA-MB231, MDA-MB 468, MDA-MB 436, B-20, BT-549, H578T). β-actin served as internal control. PSMD3 bands densities were normalize to β-actin. (B) Detection of PSMD3 expression at mRNA level in 15 pairs normal versus tumor breast tissue samples were detected by reverse transcriptase (RT)- polymerase chain reaction (PCR). β-actin served as internal control. (C) The PSMD3 mRNA expression profiles of paired human breast tumor (red lines) and normal (green lines) tissues (n = 176) were detected by real-time PCR. (D) Comparison of PSMD3 mRNA expression between normal (N) and tumor (T) pairs (n = 176), copy number (mg /mRNA). PSMD3 mRNA expression levels in 23 patients’ samples in which PSMD3 mRNA expression was higher in normal tissue than in tumor tissue (Group 1) versus 153 patient samples in which expression was higher in tumor tissue than normal tissue (Group 2). Error bars indicate the 95% confidence interval. Data was analyzed with 2-sided paired t-test (*** p <0.001). (E) Analysis of PSMD3 copy number levels between BC subtypes, including (Estrogen Receptor; ER− vs. ER−, Progesterone receptor; PR− vs. PR+, HER2− vs. HER2+, and Triple Negative Breast Cancer; TNBC vs. Non-TNBC). Error bars indicate the 95% confidence interval. Data was analyzed with independent t-test (* p < 0.05). (F) Representative images for PSMD3 Immunohistochemistry (IHC) immunostaining Tumor area versus normal area (Upper panel) (100× and 400×) and hematoxylin and eosin staining (lower panel) (100× and 400×).

