Figure 6.
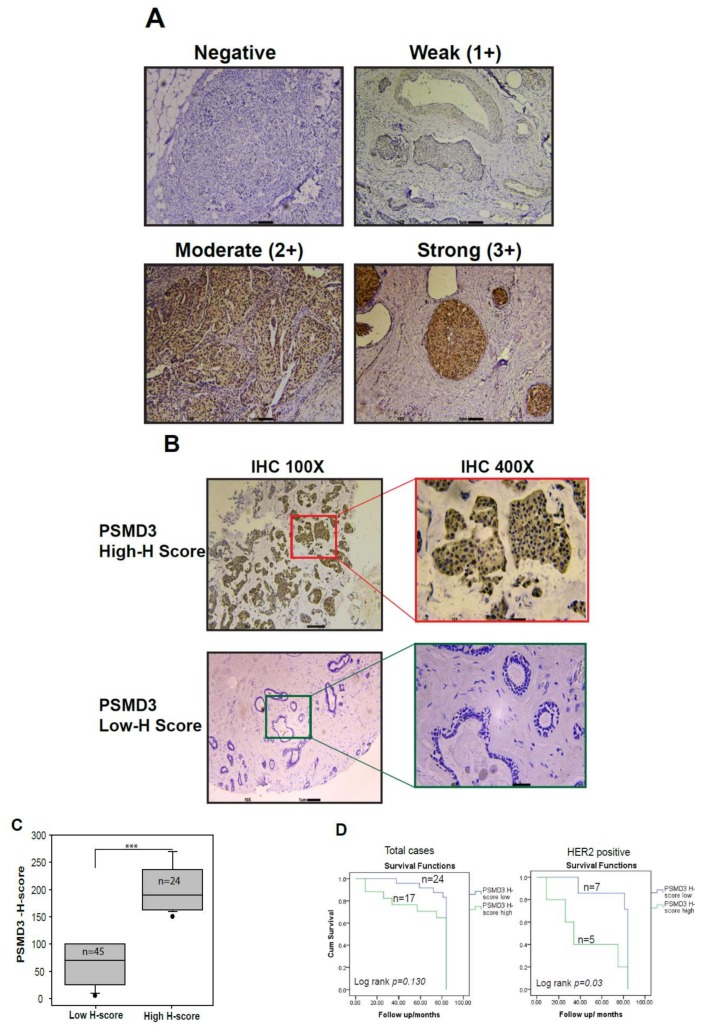
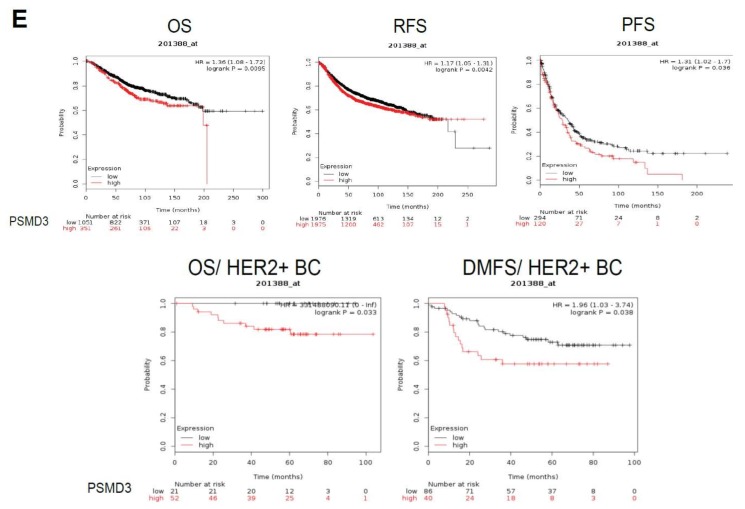
Detection of PSMD3 expression by IHC staining and association of PSMD3 with clinical overall survival. (A) Representative images for PSMD3 IHC scoring system. The scoring system was determined as Negative (0), Weak (1+), Moderate (2+), and Strong (3+) based on PSMD3 staining intensity. Scale bar is 1 µM (10×). (B) Representative images for low H-score (normal breast cells) versus high H-Score (tumor breast cells). Note the cytoplasmic and nuclear staining in tumor cells (original magnification 100× and ×400). (C) Histological analysis of PSMD3 expression in BC patients based on H-score value (p < 0.001 ***). (D) Kaplan–Meier survival curves of breast cancer patients. A comparison of low- and high-PSMD3 H-score in HER2+ versus total cases. The difference between the survival curves was calculated using the log-rank test. PSMD3 expression level was calculated using PSMD3 protein H-score. (E) Kaplan–Meier Plotter survival curves of breast cancer (BC) patients. Comparison of low- and high-PSMD3 mRNA level in BC Overall survival (OS), Relapse-free survival (RFS), and progression-free survival (PFS) and in HER2+ BC; (OS) and distant metastasis-free survival (DMFS). The difference between the survival curves was calculated using the log-rank test.


